For all your fancy-pants statistical needs.

Praise for The Basketball Distribution:

"...confusing." - CBS
"...quite the pun master." - ESPN

NCAA Teams' Bench Impact

Bench Impact = estimated total Bench Rating per 100 possessions x %Minutes - estimated Starters' Rating per 100 possessions x %Minutes

-Wyoming/Colorado's bench impact is low because of true disparity between their starting 5 and their bench.
-Ohio State's bench is actually decent, but their starting 5 is significantly better....
-Grambling suffers immensely by not playing Quincy Roberts more -- EDIT -- this was because of the transfer rules that prevented Q-Rob from playing the first half of the season, so technically he was on their "bench" when I ranked his minutes played back in January. His presence was definitely the most notable discrepancy in minutes played and overall value because of that.


Bottom 25


teambench impact
1Wyoming-10.35
2South Carolina Upstate-10.31
3Colorado-9.36
4Green Bay-9.14
5Alabama State-9.08
6Florida International-9.01
7Ohio State-8.96
8Northern Iowa-8.90
9Maryland-8.78
10Evansville-8.75
11Cal Poly-8.62
12Monmouth-8.61
13Texas State-8.56
14Tennessee State-8.18
15South Carolina-7.94
16Lehigh-7.87
17Lamar-7.85
18Jackson State-7.84
19Southeast Missouri State-7.78
20Rider-7.76
21Tennessee-Martin-7.74
22Xavier-7.67
23Pepperdine-7.63
24St. Francis (NY)-7.57
25Utah-7.35


Top 25

teambench impact
1Grambling5.87
2South Alabama2.79
3Vermont2.54
4Colorado State2.50
5Loyola Marymount2.46
6North Carolina-Greensboro1.75
7Texas Southern1.53
8Oklahoma State1.39
9Western Carolina1.03
10William & Mary1.00
11Cornell0.97
12Marist0.94
13California-Santa Barbara0.85
14Maryland-Eastern Shore0.68
15Western Michigan0.51
16IPFW0.49
17Southern Mississippi0.41
18Alcorn State0.35
19Southeastern Louisiana0.35
20Southern Methodist0.28
21Canisius0.26
22Rhode Island0.26
23Miami (FL)0.24
24Toledo0.15
25East Tennessee State0.13

Top 25 Players as of 1/18/2011

I have adjusted minutes% for teammate quality and injuries (I factor back in minutes played above or below what we would expect a coach to play them with a number I call SQZ: how much more or less a coach squeezes out of a player over the course of a game.)

True Impact per Game = Efficiency Impact x (expected min% while healthy, with average teammates)

 rankplayerteamORTGusage%DRTGTrue Impact per Game
1Kevin JonesWest Virginia129.624.292.59.6
2Jared SullingerOhio State128.926.3769.4
3Damian LillardWeber State136.132.299.29.4
4Marcus DenmonMissouri140.523.293.98.6
5Thomas RobinsonKansas117.328.278.78.5
6Anthony DavisKentucky140.51873.68.1
7Doug McDermottCreighton127.731.61027.9
8Kenny BoyntonFlorida135.924.6102.87.6
9Dominique MorrisonOral Roberts13125.4103.17.4
10Will BartonMemphis1192694.47.3
11Cody ZellerIndiana13422.2907.2
12J'Covan BrownTexas122.628.2100.77.1
13John ShurnaNorthwestern117.527.4102.47.0
14Mike ScottVirginia127.128.782.36.9
15Jae CrowderMarquette124.623.384.66.7
16Isaiah CanaanMurray State130.326.495.86.6
17Deshaun ThomasOhio State124.823.889.76.6
18Hollis ThompsonGeorgetown12921.3936.6
19John JenkinsVanderbilt127.126.31016.6
20Nate WoltersSouth Dakota State121.230101.96.4
21Ricardo RatliffeMissouri138.222.491.56.3
22Jeremy LambConnecticut120.923.61006.2
23Drew CrawfordNorthwestern119.125.5104.76.2
24Jordan TaylorWisconsin115.824.586.76.2
25Jason ClarkGeorgetown117.526.189.86.0

Top 25 Freshies, as of 1/11/2012

EDIT: Misleading title. This only includes games through 1/11, not 1/13.

By team impact (estimated efficiency margin impact times % of possessions played).


rankplayerteamconfORTGusage%DRTGEff Imp.Team Imp.
1Anthony DavisKentuckySEC13418719.376.79
2Cody ZellerIndianaBig Ten13422869.636.50
3Kevin PangosGonzagaWCC13221977.755.88
4Michael Kidd-GilchristKentuckySEC12021855.964.60
5Sheldon McClellanTexasBig 1213221967.174.58
6Spencer DinWiddieColoradoPac-1212721965.963.76
7Trey BurkeMichiganBig Ten11025974.303.67
8D'Angelo HarrisonSt. John's (NY)Big East116241023.813.32
9Austin RiversDukeACC108261034.473.32
10Seth TuttleNorthern IowaMVC12319896.143.23
11Kentavious Caldwell-PopeGeorgiaSEC10927994.153.18
12Adam SmithNorth Carolina-WilmingtonCAA116271114.083.09
13Jonathan HolmesTexasBig 1212619945.533.06
14Anthony DrmicBoise StateMWC12324984.663.06
15Omari GrierFlorida AtlanticSun Belt130211056.583.04
16Justin EdwardsMaineAEC12026993.973.01
17Otto PorterGeorgetownBig East11616884.192.85
18Jordan TolbertTexas TechBig 1211331964.682.76
19Rodney HoodMississippi StateSEC125171003.192.69
20Andre DrummondConnecticutBig East11220943.832.59
21B.J. YoungArkansasSEC11727944.322.56
22P.J. HairstonNorth CarolinaACC12426937.682.50
23Quinn CookDukeACC137201027.872.48
24Quincy MillerBaylorBig 1210925884.022.34
25Michael CaffeyLong Beach StateBig West12015984.342.33

Top 51 Overall NCAA Players as of 1/10

Games through 1/10.
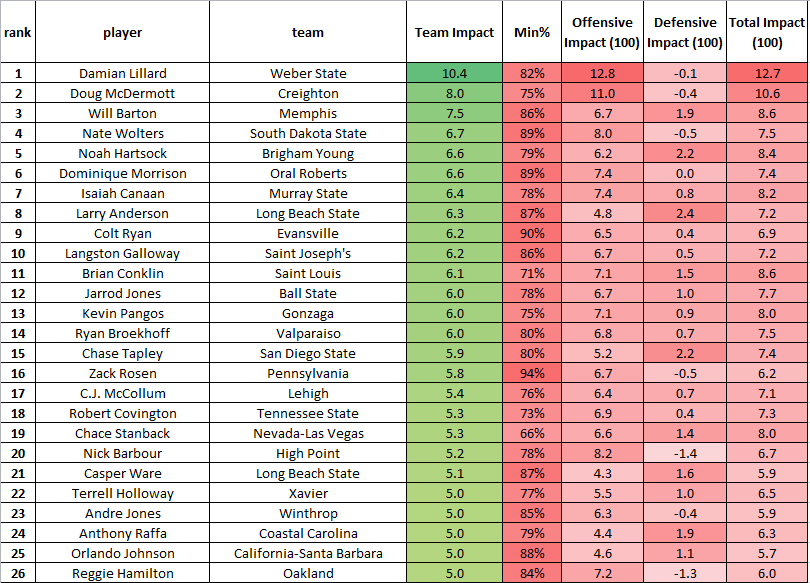
Team Impact = (Estimated Efficiency Impact per 100 possessions) x (% of Possessions played in)
Where offensive and defensive efficiency impacts are estimated* by using offensive and defensive rating (& offensive usage%) at sports-reference.com, and strength of schedule from kenpom.com.


rankplayerteamconfOffensive Impact (100)Defensive Impact (100)Total Impact (100)Team ImpactMin%
1Damian LillardWeber StateBig Sky13.5-0.413.111.084%
2Kevin JonesWest VirginiaBig East7.92.210.19.190%
3Doug McDermottCreightonMVC11.1-0.610.58.177%
4Dominique MorrisonOral RobertsSummit9.0-0.18.97.989%
5Jared SullingerOhio StateBig Ten8.04.812.87.861%
6Marcus DenmonMissouriBig 129.10.79.87.880%
7Isaiah CanaanMurray StateOVC8.90.69.57.579%
8Will BartonMemphisCUSA6.71.78.47.387%
9Thomas RobinsonKansasBig 124.84.59.37.277%
10Kenny BoyntonFloridaSEC10.0-0.89.27.278%
11Mike ScottVirginiaACC7.52.19.67.073%
12Jae CrowderMarquetteBig East6.72.69.37.075%
13Anthony DavisKentuckySEC4.25.29.46.873%
14Cody ZellerIndianaBig Ten7.12.59.66.568%
15Nate WoltersSouth Dakota StateSummit8.2-0.67.66.485%
16Jeremy LambConnecticutBig East6.10.97.06.390%
17Noah HartsockBrigham YoungWCC5.52.47.96.379%
18Colt RyanEvansvilleMVC6.80.16.96.290%
19Jarrod JonesBall StateMAC6.81.27.96.278%
20Larry AndersonLong Beach StateBig West5.02.07.16.287%
21John JenkinsVanderbiltSEC7.70.48.16.276%
22Doron LambKentuckySEC7.01.18.16.176%
23Ryan BroekhoffValparaisoHorizon7.00.67.66.180%
24Ryan KellyDukeACC7.81.99.66.062%
25Hollis ThompsonGeorgetownBig East6.41.57.95.976%
26Deshaun ThomasOhio StateBig Ten6.02.48.45.970%
27Kevin PangosGonzagaWCC6.71.07.75.976%
28Drew CrawfordNorthwesternBig Ten6.9-0.16.85.785%
29Steven PledgerOklahomaBig 127.40.37.75.674%
30Kris JosephSyracuseBig East5.61.97.55.674%
31C.J. McCollumLehighPatriot6.90.37.25.677%
32Jordan TheodoreSeton HallBig East4.71.56.25.590%
33Brian ConklinSaint LouisA-106.31.47.75.571%
34J'Covan BrownTexasBig 125.90.86.75.582%
35Reggie HamiltonOaklandSummit7.8-1.26.65.584%
36Chase TapleySan Diego StateMWC5.31.66.95.580%
37Langston GallowaySaint Joseph'sA-105.60.86.45.585%
38Allen CrabbeCaliforniaPac-125.41.26.65.482%
39John ShurnaNorthwesternBig Ten6.00.16.15.488%
40Deonte BurtonNevadaWAC6.50.57.05.477%
41Zack RosenPennsylvaniaIvy6.1-0.35.75.494%
42Erick GreenVirginia TechACC6.20.76.95.377%
43Julian MavungaMiami (OH)MAC4.71.05.65.394%
44Draymond GreenMichigan StateBig Ten3.23.46.65.380%
45Chace StanbackNevada-Las VegasMWC6.51.58.05.366%
46Anthony RaffaCoastal CarolinaBig South4.71.86.55.280%
47Robbie HummelPurdueBig Ten5.41.46.85.176%
48Trevor RelefordAlabamaSEC4.52.57.05.173%
49Ricardo RatliffeMissouriBig 127.31.48.75.159%
50Robert CovingtonTennessee StateOVC6.80.27.05.173%
51Tyler ZellerNorth CarolinaACC4.93.07.85.165%


So, Lillard is the primary reason that an otherwise-extremely-mediocre offensive team (Pomeroy subscribers only) is #57th in the Pomeroys for offense. Weber's second-best offensive player (Scott Bamforth) uses 10% usage less, and is 10 points per 100 less efficient.

When I sum up all of Weber State's offensive contributions, we get +14.4. Their adjusted offensive rating is only +8 or so on kenpom.com, so it's my guess that (but if we just fit players' performances to their team ratings, we get some extremely ugly results, so I don't do that...I am basing it on last year's fit for Strength of Schedule, however). Even if we multiply each player's offensive value by 0.6 (which is roughly the same as 8/14.4), Lillard is still a top-25 player.


Mike Scott is still also an extremely good player as far as the eye can see, and is even underrated by his minutes (like Sullinger).


* Not going to reveal the regression equation just yet. Or ever :-)

No Apologies, Just Numbers

Okay, some apologies.


My prior post has sparked a little bit of interest/intrigue/outrage/fear among college basketball fans.
Never fear! Happier numbers are on the way.

First, let me reiterate that these are based on advanced stats only, such as offensive rating and defensive rating, from Sports-Reference.com. There are no plus-minus stats involved.

I realized that there were some pretty important adjustments that needed to be made. First, that players with extremely high numbers in any one category were being skewed.* Second, that the strength of schedule adjustment was a little counter-intuitive, and a little too strong. I adjusted my ratings thusly.

Unfortunately, the sample size for this season does not produce very intuitive results at the moment, which I should have mentioned in my last post (so please don't destroy me for anything that looks strange...just chew on it). For example, that Weber State's Damian Lillard is number one in the system. While I am a huge fan of Lillard and would have no problem listing him up there at the end of the year if things remain the same, I am wary of the fact that his team impact is two full points higher than the next-highest (and his per-possession impact is higher than Sullinger's). As major-conference teams improve their strength of schedules during conference play and players get more minutes, things will even out.

As proof that things will even out, here is last year's top-10 in terms of overall Team Impact (efficiency impact times minutes-on-the-floor%). We can call this the Holy Grail 3.0

Player School Impact(100)  Team Eff. Impact
Kemba Walker Connecticut 13.1 12.1
Jordan Taylor Wisconsin 12.4 11.2
Talor Battle Penn State 10.3 9.8
Jimmer Fredette Brigham Young 11.0 9.7
Jared Sullinger Ohio State 12.2 9.6
JaJuan Johnson Purdue 10.4 9.2
Derrick Williams Arizona 11.8 8.7
Jon Leuer Wisconsin 10.4 8.7
Ben Hansbrough Notre Dame 9.7 8.4
Jon Diebler Ohio State 9.3 8.3

I hope most people wouldn't have a problem with this list.

So here are the current numbers, which are now split into offense and defense...separated by the Top-26 Major Conference Players and the Top 26 not-so-Major Conferences. (Had to include the older Zeller. It's the law.)

Major:


Not-So-Major:


Notice I refrained from ranking players by their per-possession numbers...I think these are more intuitive and represent Player-of-the-Year candidates (if your coach didn't play you enough, you unfortunately didn't impact your team enough).

And look, Hummel is on a list! Now everyone can be happy. Even me!


* My method involved dividing advanced statistics such as Steal%, Assist%, or Offensive Rating by their league average. My NBA numbers had extremely high sample sizes and didn't have any problem with skewed numbers...here we have that problem a lot more, especially in smaller categories (such as Steal%) rather than larger categories (the more all-encompassing "Offensive Rating").

The Holy Grail 2.5: NCAA Player Ratings (1/4/2012)

EDIT: I have updated my methodology and made things a little easier to understand, I hope: http://www.thebasketballdistribution.com/2012/01/no-apologies-just-numbers.html

Now that Sports-Reference.com uses the same advanced stats for NBA and College players, it has become very simple and straightforward to create a statistical +/- based on advanced stats for college players.

BORING STUFF:

In order to adjust for college, I simply use each advanced stat* divided by its league average. Then, applying the same to college works well. I fit the 2010-2011 season's worth of raw statistical +/- data to each team's efficiency margin, and then to their adjusted efficiency margin. I then built a model that combines raw statistical +/- and team strength of schedule (simply Adjusted Efficiency Margin mins Raw Efficiency Margin, via kenpom.com) to give us an "adjusted Statistical +/-" that we will call (as we have before) Efficiency Impact.

/END BORING STUFF

For each player, we can look at Efficiency Impact per 100-possessions, and Team Efficiency Impact(their efficiency impact times the % of their team's possessions they played in).

Here are the top 100 players in both of those categories. First, efficiency impact per 100 possessions (25% of teams' minutes played to qualify)


rankplayerteamEfficiency Impact/100
1Jared SullingerOhio State19.4
2Russ SmithLouisville16.8
3Thomas RobinsonKansas15.8
4Damian LillardWeber State15.8
5Mike ScottVirginia14.9
6Dion WaitersSyracuse14.7
7James SoutherlandSyracuse14.0
8JaMychal GreenAlabama13.9
9Cody ZellerIndiana13.7
10C.J. McCollumLehigh13.6
11Marcus DenmonMissouri13.4
12Anthony DavisKentucky13.2
13Jae CrowderMarquette13.2
14Jared BerggrenWisconsin13.1
15Isaiah CanaanMurray State12.9
16Jarrod JonesBall State12.8
17Brian ConklinSaint Louis12.5
18Jamaal FranklinSan Diego State12.4
19Ryan PearsonGeorge Mason12.1
20Herb PopeSeton Hall11.7
21Doug McDermottCreighton11.5
22Arsalan KazemiRice11.4
23Kevin JonesWest Virginia11.4
24Anthony RaffaCoastal Carolina11.3
25Miguel PaulEast Carolina11.3
26Chase TapleySan Diego State11.2
27Ricardo RatliffeMissouri11.2
28Ryan EvansWisconsin11.1
29Henry SimsGeorgetown11.1
30Draymond GreenMichigan State10.9
31Cody EllisSaint Louis10.8
32Luke MartinezWyoming10.6
33Jereal ScottStephen F. Austin10.6
34Noah HartsockBrigham Young10.5
35Mike MoserNevada-Las Vegas10.5
36Tyler ZellerNorth Carolina10.4
37Carlos LopezNevada-Las Vegas10.4
38Quinn CookDuke10.3
39Will BartonMemphis10.3
40Kris JosephSyracuse10.3
41Rob JonesSaint Mary's (CA)10.2
42Dominique SuttonNorth Carolina Central10.2
43Jordan TaylorWisconsin10.2
44Jason ClarkGeorgetown10.2
45Ian HummerPrinceton10.2
46Steven WernerSam Houston State10.1
47Leonard WashingtonWyoming10.1
48Robert CovingtonTennessee State10.1
49Drew GordonNew Mexico10.0
50P.J. HairstonNorth Carolina10.0
51Trevor RelefordAlabama9.9
52Tony MitchellAlabama9.9
53Ryan KellyDuke9.8
54William BufordOhio State9.8
55Terrell HollowayXavier9.7
56Kenny BoyntonFlorida9.7
57Harrison BarnesNorth Carolina9.7
58John HensonNorth Carolina9.7
59Terell ParksWestern Illinois9.6
60Victor OladipoIndiana9.6
61Carl HallWichita State9.5
62Deshaun ThomasOhio State9.4
63Davante GardnerMarquette9.4
64Ken HortonCentral Connecticut State9.4
65Javon McCreaBuffalo9.4
66Joe RaglandWichita State9.4
67D'Aundray BrownCleveland State9.4
68Michael Kidd-GilchristKentucky9.3
69Steven PledgerOklahoma9.3
70Donte PooleMurray State9.3
71Robbie HummelPurdue9.3
72Brandon FortenberrySoutheastern Louisiana9.3
73Doron LambKentucky9.3
74Khris MiddletonTexas A&M9.2
75Evan SmotryczMichigan9.1
76Jackie CarmichaelIllinois State9.1
77Jorge GutierrezCalifornia9.0
78Chace StanbackNevada-Las Vegas9.0
79Velton JonesRobert Morris9.0
80Jaquon ParkerCincinnati9.0
81Kenton WalkerSaint Mary's (CA)8.9
82Kevin PangosGonzaga8.9
83Erick GreenVirginia Tech8.9
84Quincy AcyBaylor8.8
85Nate WoltersSouth Dakota State8.8
86Mark LyonsXavier8.8
87Arnett MoultrieMississippi State8.8
88D.J. CooperOhio8.7
89Sheldon McClellanTexas8.7
90Jamar SamuelsKansas State8.7
91Hollis ThompsonGeorgetown8.7
92Trevor MbakweMinnesota8.7
93Reggie BullockNorth Carolina8.7
94Tony SnellNew Mexico8.7
95Jamal FentonNew Mexico8.7
96Brad WaldowSaint Mary's (CA)8.6
97Scott SaundersBelmont8.6
98Mike Dixon, Missouri8.6
99Maurice KempEast Carolina8.5
100Jamar GulleyMissouri State8.5


rankplayerteamTeam Efficiency ImpactEfficiency Impact/100Min%
1Thomas RobinsonKansas12.315.877.7%
2Damian LillardWeber State12.115.876.8%
3Jared SullingerOhio State11.819.461.0%
4Jarrod JonesBall State11.312.888.6%
5Mike ScottVirginia10.714.972.2%
6Marcus DenmonMissouri10.513.478.6%
7C.J. McCollumLehigh10.413.676.3%
8Kevin JonesWest Virginia10.111.488.8%
9Isaiah CanaanMurray State9.812.976.1%
10Herb PopeSeton Hall9.711.783.2%
11Anthony DavisKentucky9.513.272.3%
12Anthony RaffaCoastal Carolina9.511.384.1%
13Cody ZellerIndiana9.213.767.1%
14Chase TapleySan Diego State9.011.280.7%
15Jae CrowderMarquette9.013.268.2%
16Draymond GreenMichigan State8.810.980.9%
17Jordan TaylorWisconsin8.810.286.4%
18Ryan PearsonGeorge Mason8.812.172.9%
19Brian ConklinSaint Louis8.712.569.6%
20Jared BerggrenWisconsin8.713.166.7%
21Ian HummerPrinceton8.610.284.5%
22Will BartonMemphis8.610.383.2%
23Miguel PaulEast Carolina8.511.374.7%
24Rob JonesSaint Mary's (CA)8.410.282.2%
25Noah HartsockBrigham Young8.310.578.6%
26Doug McDermottCreighton8.211.571.1%
27William BufordOhio State8.29.883.5%
28Russ SmithLouisville8.216.848.4%
29Dominique SuttonNorth Carolina Central8.110.278.9%
30Tony MitchellAlabama7.99.980.0%
31Dion WaitersSyracuse7.814.753.2%
32Nate WoltersSouth Dakota State7.88.888.6%
33Ryan EvansWisconsin7.711.168.8%
34Robert CovingtonTennessee State7.610.175.5%
35Mike MoserNevada-Las Vegas7.610.572.5%
36Kenny BoyntonFlorida7.69.778.0%
37Ken HortonCentral Connecticut State7.69.480.4%
38JaMychal GreenAlabama7.513.954.0%
39D'Aundray BrownCleveland State7.59.480.4%
40Jason ClarkGeorgetown7.510.273.6%
41Arsalan KazemiRice7.511.465.2%
42Drew GordonNew Mexico7.410.074.0%
43Kris JosephSyracuse7.410.372.2%
44Terrell HollowayXavier7.49.776.0%
45Jordan TheodoreSeton Hall7.47.795.9%
46Jereal ScottStephen F. Austin7.410.669.8%
47Jamaal FranklinSan Diego State7.212.457.7%
48Trevor RelefordAlabama7.19.971.9%
49Michael Kidd-GilchristKentucky7.19.376.2%
50Doron LambKentucky7.19.376.2%
51Robbie HummelPurdue7.09.375.5%
52Deshaun ThomasOhio State7.09.474.2%
53Larry AndersonLong Beach State6.97.987.1%
54Tim FrazierPenn State6.97.789.2%
55Terell ParksWestern Illinois6.99.671.8%
56D.J. CooperOhio6.88.778.2%
57Jeremy LambConnecticut6.88.184.1%
58Kevin PangosGonzaga6.88.976.7%
59Langston GallowaySaint Joseph's6.87.985.8%
60Edwin FuquanSeton Hall6.87.689.7%
61Greg ManganoYale6.88.085.2%
62J'Covan BrownTexas6.88.084.6%
63Ricardo RatliffeMissouri6.811.260.5%
64Henry SimsGeorgetown6.811.161.0%
65Ryan BroekhoffValparaiso6.78.579.2%
66Erick GreenVirginia Tech6.78.975.4%
67Tyler ZellerNorth Carolina6.710.464.3%
68Velton JonesRobert Morris6.79.074.0%
69John HensonNorth Carolina6.69.768.8%
70Luke MartinezWyoming6.610.662.9%
71Donte PooleMurray State6.69.371.3%
72Isaiah WilkersonNJIT6.67.884.6%
73Jared CunninghamOregon State6.57.784.5%
74Dominique MorrisonOral Roberts6.57.388.6%
75Julian MavungaMiami (OH)6.45.9108.9%
76Steven PledgerOklahoma6.49.368.7%
77Drew CrawfordNorthwestern6.47.683.8%
78Quincy AcyBaylor6.38.871.9%
79Javon McCreaBuffalo6.39.467.4%
80Bradford BurgessVirginia Commonwealth6.37.980.0%
81Hollis ThompsonGeorgetown6.38.772.5%
82Leonard WashingtonWyoming6.310.162.3%
83Harrison BarnesNorth Carolina6.39.765.0%
84Jorge GutierrezCalifornia6.29.068.8%
85John JenkinsVanderbilt6.28.276.0%
86Ryan KellyDuke6.29.862.9%
87Aaron CraftOhio State6.28.077.7%
88Victor OladipoIndiana6.29.664.6%
89Matthew DellavedovaSaint Mary's (CA)6.26.891.1%
90Reggie HamiltonOakland6.17.285.9%
91Andre RobersonColorado6.18.571.8%
92Joe Harris Virginia6.18.075.9%
93Colt RyanEvansville6.07.580.7%
94Sean KilpatrickCincinnati6.07.184.4%
95Mike MuscalaBucknell6.07.678.8%
96Kerron JohnsonBelmont6.08.471.4%
97Tony SnellNew Mexico5.98.768.3%
98Chace StanbackNevada-Las Vegas5.99.065.8%
99Jeffery TaylorVanderbilt5.97.777.0%
100DeAndre KaneMarshall5.97.281.9%


Quite a few mid-majors at the top here, but the strength-of-schedule adjustment is well-calibrated. These will probably match somewhat closely to Pomeroy's "KPOY."


* - My raw regression involves Defensive Rating, Offensive Rating, Usage%, Assist%, and Steal%.

NCAA Power Ratings

I now have my own usually-updated NCAA power ratings. (Located at the top of the page).

These are simply based on point margin, and I adjust for consistency, recency, and which teams appear to play up or down to their opponents (i.e. fixing the issue of cupcake-killers), in the spirit of the work of DSMok1 aka Daniel.

"Original Rating" is basically SRS, simply adjusting a team's point differential by their opponent's point differential several layers down.

"Quality Rating" weighs each opponent/game by their "original rating" and whether or not a game was at home or away. The final result of a very difficult game is worth the most in this average, and the final result of a very easy game impacts this the least.

"Cupcake Rating" does the exact opposite of "quality rating."

Finally, each team is ranked by using my expected outcome (from Quality/Cupcake/Original ratings) against the top-25 "Original" teams. This gives us a basic idea of how teams might fare come March.

The Major-Conference Offensive Impact Leaders


Pretty self-explanatory. I've made a few important corrections to the formula recently.*
Must have played 40% of minutes to qualify.
Offensive rating and team SOS data from kenpom.com


playerConfadjOI
1Marcus Denmon (Missouri)B1211.40
2Steven Pledger (Oklahoma)B1211.00
3Henry Sims (Georgetown)BigEast9.41
4Kenny Boynton (Florida)SEC9.27
5Jared Sullinger (Ohio St.)B109.21
6Ricardo Ratliffe (Missouri)B129.18
7Tyrus McGee (Iowa St.)B128.55
8Travon Woodall (Pittsburgh)BigEast8.17
9Cody Zeller (Indiana)B108.10
10Kevin Jones (West Virginia)BigEast8.01
11Davante Gardner (Marquette)BigEast7.80
12Jae Crowder (Marquette)BigEast7.79
13Darius Johnson-Odom (Marquette)BigEast7.77
14Mike Scott (Virginia)ACC7.77
15Hollis Thompson (Georgetown)BigEast7.24
16J'Covan Brown (Texas)B127.22
17Arnett Moultrie (Mississippi St.)SEC7.14
18Terrell Stoglin (Maryland)ACC7.12
19Dion Waiters (Syracuse)BigEast7.00
20Pierre Jackson (Baylor)B127.00
21JaMychal Green (Alabama)SEC6.97
22Doron Lamb (Kentucky)SEC6.97
23Jeremy Lamb (Connecticut)BigEast6.76
24Erick Green (Virginia Tech)ACC6.64
25Erving Walker (Florida)SEC6.63
26Tyler Zeller (North Carolina)ACC6.57
27Robbie Hummel (Purdue)B106.38
28Andre Young (Clemson)ACC6.14
29Shabazz Napier (Connecticut)BigEast5.99
30Brandon Young (DePaul)BigEast5.98
31Mike Rosario (Florida)SEC5.96
32Nasir Robinson (Pittsburgh)BigEast5.77
33John Jenkins (Vanderbilt)SEC5.73
34Drew Crawford (Northwestern)B105.71
35Thomas Robinson (Kansas)B125.70
36Ashton Gibbs (Pittsburgh)BigEast5.61
37Maalik Wayns (Villanova)BigEast5.53
38Trae Golden (Tennessee)SEC5.47
39Ryan Kelly (Duke)ACC5.45
40Kris Joseph (Syracuse)BigEast5.41
41Deshaun Thomas (Ohio St.)B105.39
42C.J. Harris (Wake Forest)ACC5.37
43B.J. Young (Arkansas)SEC5.22
44Scott Wood (North Carolina St.)ACC5.11
45Jeronne Maymon (Tennessee)SEC5.10
46Reggie Bullock (North Carolina)ACC5.07
47Trevor Mbakwe (Minnesota)B105.04
48John Shurna (Northwestern)B104.99
49Victor Oladipo (Indiana)B104.96
50Mouphtaou Yarou (Villanova)BigEast4.95


* I adjusted the overall formula slightly** to more evenly adjust for competition, and to more accurately portray players (R^2 is about 5% better than my prior formula)

**
adjDsos = (% of games against D-I * Adj Def.SOS) + (% games against non D-I * 114)
PointsProducedPer100=ORTG*PercentPoss/100
adjOI = (PointsProducedPer100)/(100.3*0.2)*n1 + PercentPoss/20*n2 + ORTG/100.3*n3 + 0.2*(100.3-adjD.SOS)

where:
n1= 26.97
n2= -22.38
n3= -4.73

Indiana great. Gonzaga good. Cal mediocre.


This is my original method for rating teams after which my blog is named, although I've never done league-wide rankings.The normal distribution states that each team's chance of winning is dependent on their strength (efficiency or point differential) and the consistency of that strength (the standard deviation of efficiency differential).

I adjust standard deviation for competition by simply using Actual minus Expected point margin.*


Let's look at the ten teams who gain the most in terms of win% when we adjust for consistency.


teamwin% diffpyth rnk (adj rnk)adj win%
1Gonzaga8.7%34 (20)93.5%
2Murray St.8.7%50 (31)89.1%
3Temple8.6%36 (21)92.7%
4Creighton8.5%55 (33)88.2%
5Indiana8.1%14 (5)98.2%
6Miami FL7.7%63 (55)83.9%
7Lehigh7.6%88 (67)77.9%
8Tulsa7.3%95 (75)74.6%
9Connecticut7.2%23 (12)95.4%
10Long Beach St.7.0%47 (35)87.8%

Gonzaga's actual versus expected point margin only has a standard deviation of 6.1 - this is significantly low.

Next, the ten teams in Pomeroy's top-100++ who drop the most.
(++The list was mostly bottom-feeders anyways, so we'll just look at teams we care more about).


win% diffpyth rnk (adj rnk)adj win%
1California-2.7%20 (44)86.4%
2Purdue-2.7%15 (40)87.0%
3Virginia-0.4%24 (36)87.8%
4Florida St.-0.1%32 (48)85.8%
5Baylor0.7%13 (25)90.9%
6West Virginia1.2%33 (46)86.3%
7St. Louis1.2%22 (30)89.6%
8Missouri1.2%8 (17)94.0%
9Marquette1.5%6 (13)94.7%
10New Mexico1.8%37 (50)85.3%

Cal plays very strongly on average, but has an adjusted standard deviation of 15.7. Quite inconsistent.


And here are the top 25 overall:

teamadj win%pythdiff
1Kentucky0.99130.96860.0227
2Ohio St.0.99070.96470.0259
3Syracuse0.98900.95110.0379
4North Carolina0.98850.95190.0366
5Indiana0.98170.90110.0806
6Kansas0.98130.93100.0503
7Wisconsin0.98120.97330.0080
8Duke0.97890.92640.0525
9Michigan St.0.97400.91550.0586
10Florida0.97100.91580.0552
11Louisville0.96900.92370.0452
12Connecticut0.95390.88160.0723
13Marquette0.94710.93210.0149
14Brigham Young0.94300.89640.0467
15Xavier0.94060.89570.0448
16Georgetown0.94000.89330.0467
17Missouri0.93970.92720.0124
18Wichita St.0.93590.87940.0565
19Stanford0.93550.89670.0388
20Gonzaga0.93530.84850.0868
21Temple0.92690.84080.0861
22Texas0.92340.88120.0422
23Nevada Las Vegas0.91240.87420.0382
24Alabama0.91190.88510.0268
25Baylor0.90860.90120.0074
 
Yes, yes. The Hoosiers are doing quite well....


*- While explaining individual parts of a team or player in "tempo-free" language is beneficial, describing a team by "efficiency margin" rather than "point margin" is not particularly beneficial. In the NBA, point margin usually predicts win-percentage only slightly worse than efficiency margin (although last year, point margin did better). However, for numerous statistical and tactical reasons, pace is important to consider, in my opinion, when rating teams. It is much easier for a team to put away opponents if they are more efficient at a much quicker pace; statistically this makes sense: the more samples we have, the better chance the final output is near our expected output. Furthermore, I don't have access to game-by-game efficiency margin, so the only way I can measure standard deviations/variance/consistency is by measuring Pomeroy-Ratings's expected point margin versus the actual game point margin.

A Terrible Blog Post About Murray St.


Data from Statsheet.com and Kenpom.com


Don't have time to write more at the moment.
This was made using the formula from Holy Grail part II, except I took out the plus-minus component (not good enough data). This means that these rankings formula is biased towards offense (+/- improves the defensive component heavily).

Also, I fit the "impact per game" to Murray State's expected efficiency margin against an average team (13.2, according to Kenpom.com).

Short, but sweet. Tells us what we already know, I suppose:

1) Canaan rules on offense.
2) The Racers are pretty dern good at stealing the ball (#39 in Stl% as a team).

Top 10 Offensive Impact Players, as of 12/2


I've updated the formula slightly* since I wrote the essay for the College Basketball Prospectus preview this year. Offensive Ratings, usage, and strength of schedule all from kenpom.com.

Offensive impact estimates how much a player's contributions (by usage & efficiency) impact his team's offense above average (i.e. a +13 player would make an average team score 1.13 PPP, if the league average was 1 PPP).

PlayerTeamYearORTG%USGadjusted Offensive Impact
1Marcus DenmonMissouriSr143.324.213.0
2Damian LillardWeber St.Jr125.731.712.8
3Steven PledgerOklahomaJr146.521.711.9
4Darius Johnson-OdomMarquetteSr134.725.111.7
5Ricardo RatliffeMissouriSr142.922.511.6
6Doug McDermottCreightonSo127.228.711.6
7Anthony DrmicBoise St.Fr135.424.211.0
8Trae GoldenTennesseeSo122.630.511.0
9Tahj TateDelaware St.Fr120.831.210.9
10Justin EdwardsMaineFr130.225.910.8

I expect more Major-Conference heavy hitters to top this list soon. We've all taken the oath of small sample sizes here, right?

I don't feel comfortable sharing more than the top-10 because many players with Top-50 Offensive Impact numbers are cut out by not having high enough Offensive Ratings (for example: Jordan Taylor, at least at the moment) to be grouped on Pomeroy's site. But I don't have the time to input every NCAA player manually.


*Math:
The coefficients for ORTG, Usage, and ORTG*Usage are still the same, but I used a more theory-based adjustment for strength of schedule. Also I added a term that helps predict team ORTG better (the numbers were too small so each player gets boosted by 1ish).

Why North Carolina Will Win The National Championship


Because John Henson is magic.

"Whhhhhhhhh"
"OKAY! YOU CAN HAVE IT!"

Heels vs. Badgers, Predicted Four-Factors

Hey, that title kinda rhymes.


I've been trying to create adjusted four-factors for quite a while now, and I've finally settled on a method that is somewhat sound. First, I adjusted each team's four-factors for strength of schedule. Then I adjusted for home-court advantage using a similar method. Here are my predicted results for UNC v Wisconsin.


eFG%TO%OR%FTREfficiency
UNC48.217.431.839.5101.9
WISC49.719.133.49.9100.4

All the margins here are very slight, except for Free-Throw-Rate, which seems about right considering the Heels' and Badgers' status quo.*

Caveat: If we adjust Free-Throw-Rate for FT%, UNC's efficiency would most certainly drop in this formula. The four factors explain 95-99% of a team's efficiency. The remainder mostly comes from OR% being overrated when eFG% is "artificially" boosted by 3-pointers (this is why FG% is a necessary evil...), and free throw percentage.


*-What is the plural of quo? "Quotient"? "Quos"?? I sure hope it's not "quos."

Introducing The Holy Grail II: Offense & Defense (featuring UNC v. UNLV)

Accurate +/- data thanks to Adrian Atkinson (@freeportkid on twitter), editor of the Tar Heel Tip-off.

In this year's College Basketball Prospectus, I introduced "The Holy Grail" - a very simple formula for estimating true player offensive impact per possession based on Offensive Rating and Possessions Used. Not only does this describe player production (R^2 value of .65 against "true" player production), but it only requires a couple of inputs.

Unfortunately, this does not give us the whole picture: no defense, and no admission that "intangibles" could be in effect that are described by traditional plus-minus. This is especially useful when trying to analyze one game: the more causal/correlative statistics we have to offset any issues of sample size, the better**. Enter my new NCAA stat, which we will simply call "Efficiency Impact."

By using statistics to predict "true" player production, we can estimate a player's overall impact (offense + defense) rather than just offense. For an idea of the depth of this formula, these are the main parts of its tabulation:

  • Offensive Rating & Possessions Used
  • Defensive Rebound Percentage
  • Steal Percentage (Steals/Opponent Poss)
  • Block Percentage (Blocks / Opponent 2FGA)
  • Assist Rate (Assists / Team FGM)
  • Offensive & Defensive Efficiencies, both On & Off-Court
    and more...

READER'S NOTE: I have adjusted the +/- to be taken into account based on the number of possessions played; for NBA players, I estimated the amount of "noise" (inaccuracy) introduced based on low sample size, and adjusted accordingly. The same methodology is used here.

Here are the main inputs from the UNC in the UNLV game:
(In the "adjusted" categories, positive is always good, negative is always bad).

MIN%AST%STL%BLK%DR%POS%ORTGadj offense (on)adj defense(on)adj offense(off)adj defense(off)
Hairston. P.J.35.00.00.07.30.018.0204.91.6-0.60.70.1
McAdoo, James M.45.017.28.40.015.816.8114.91.4-0.30.60.2
Bullock, Reggie47.510.72.60.015.015.9110.90.9-0.30.50.2
Hubert, Desmond2.50.00.00.00.050.6151.50.00.0-0.10.2
Watts, Justin5.00.00.00.047.60.00.0-0.2-0.1-0.10.2
Strickland, Dexter72.513.01.70.06.515.7122.0-0.4-0.7-0.40.0
Marshall, Kendall77.542.70.00.012.214.6106.8-0.5-0.6-0.50.1
Henson, John*80.00.00.03.217.822.175.3-0.2-0.5-0.30.1
Zeller, Tyler*60.00.00.00.027.714.763.9-0.7-0.8-0.50.0
Barnes, Harrison*75.06.61.60.06.328.687.2-1.5-0.4-1.20.2

And here are the results:


Statistical +/- per 100Adj. +/- per 100Efficiency Impact (per 100)Efficiency Impact (Game)
Hairston. P.J.18.812.265.132.09
McAdoo, James M.12.402.233.912.05
Bullock, Reggie-0.581.450.920.51
Hubert, Desmond31.050.185.670.17
Watts, Justin3.98-0.200.510.03
Strickland, Dexter2.00-1.73-1.45-1.23
Marshall, Kendall0.33-1.84-1.87-1.69
Henson, John*-7.06-0.89-2.38-2.22
Zeller, Tyler*-8.64-2.24-3.73-2.61
Barnes, Harrison*-3.84-3.36-3.90-3.41

Hairston's insanely high offensive rating (204.9) on nearly 20% of UNC's possessions during his minutes, in addition to UNC's overall improvement in efficiency leads to Hairston leading the Heels for the game. The big 3 boys*, on the other hand, didn't even break 90 in terms of ORTG, and played for much of the game.

Desmond Hubert only really played in one possession, but grabbed an offensive board and made a free throw, thus the high usage/high ORTG and impact per 100.

I will continue posting these, especially for Carolina games as Adrian's +/- data is more reliable than StatSheet's, but I am willing to analyze more games.


* - I don't think anyone calls them that, but I just did.
** - In this prediction formula, I have largely canceled out statistics that covariate heavily, leading to coefficients that have very low p-values. Each of these in tandem lead to a rating that is well-adjusted (for example, I have found time and time again that Offensive Rating overrates players' shooting efficiency, so this formula inserts a negative term against True Shooting Percentage). Using plus-minus data is similar: why should we trust a player's box-score rating if their team did considerably worse while they were on the floor?

Tidy Text: Top Teams' Toughness Tabulation, 11/28/2011


Here's a quick look at how the top-ten-Pomeroy teams are faring early in the season.

I took each team's wins, and adjusted them for strength of opponent, home-court-advantage, and most notably, diminishing returns (for example, winning by 40 then by 20 makes you look like a +23 team, rather than a +30 team*).


TmAdjusted Win%
Wisconsin (2)0.991
Ohio St. (3)0.985
Kentucky (1)0.977
Syracuse (5)0.948
Alabama (10)0.947
Florida (8)0.941
Duke (6)0.937
Louisville (7)0.926
Missouri (9)0.924
North Carolina (5)0.921

The top 3 are playing like the top 3 (ish), Bama is playing quite well, and UNC has been lagging behind.


*This is a pretty simple excel calculation. Each game returns an adjusted efficiency margin by home-court-advantage/opponent strength, which I assume has a game-standard deviation of 16. I plug this number into the NormDist function in excel like so

=NormDist(x=Adj.Margin, mean=0, st.dev=16, cumulative=TRUE)

So when we average a 40-point win and a 20-point win (assuming a pace of 72 possessions), we get the following:

40-pt-win = .99974 win%
20-pt-win = .95873 win%

Average these two win%, and you get .97923.
The NormDist function regresses in a pretty intuitive way (theoretically, we could say that it estimate's the team's "real" win%). And, intuitively, plugging this Win% back in reverse does NOT give us +30 points, but rather +23.5 points. And so on.


The Media Audit 11/16/11: "Commodores," "Bruins," and other words one would rarely use outside discussing NCAA sport.

Stuck inside with a terrible cold, so we get a blog post!
Today we are going to look at the following three 'claims' by media or popular convention, and support or refute based on the hard data:

Claim #1: Coach K has won 903 games.

Okay, just kidding. I wish him only luck as a human being, and I wish him only ill in basketball. Moving on to the real...

Claim #1: Vanderbilt is a top-caliber team.
There are a few obvious reasons I bring this up.
  1. The Commodores were #7 in the preseason polls
  2. The Commodores were #9 in Ken Pomeroy's preseason rankings (buy the book!)
  3. The Commodores have dropped to #18 in the polls and #19 in the Pomeroy rankings after losing to Cleveland State...at home...by 13.
Couple thoughts:
Obviously, we don't have a lot of information on Vanderbilt's true ability, as they have only played three games. However, with a tough schedule ahead (Kentucky 2x, Florida 2x, Marquette, Louisvile), Vandy needs to shape up if they want to keep their losses to a minimum. Shape up, you say? Yes:
  1. Vandy shot 39.2% in effective FG% against a Cleveland St. in the post-Jarvis Varnardo era.
  2. Vandy turned the ball over on over 30% of their possessions in the same game.
  3. Biggest consistent issue: field goal defense. Vandy allowed 54.7% eFG against Oregon, 54.6% against Cleveland St, and 51% against Bucknell. For comparison, the worst average eFG defense last year was Central Arkansas, who allowed 56.2% against even weaker competition.
Vandy is starting off much worse than average at forcing misses. The best team last year with below-average eFG defense was Marquette, who did so against the ridiculously stacked Big East. Suffice to say, they gotta step things up. 

Claim #2: Belmont is not a top-caliber team.
The Bruins received votes on Monday, but did not make it into the top 25. Suffering from Davidson syndrome, Belmont decided to schedule against super-tough Duke, and somewhat-less-tough Memphis, and lost both times. As I mused earlier, Belmont's one-point loss against Duke was honestly very very impressive. The sixteen point loss at Memphis was perhaps less impressive, but Belmont had pulled within seven at the 4:30 mark in the 2nd half, on the road no less.

ESPN wrote that Belmont "put up a good fight," so perhaps the media still has their eye on the Bruins, although they will be hard to follow until March, when their fate is determined by their RPI...

Claim #3: Ben Howland should be fired.
I am a very conservative statistician, when I am being honest. To that degree, I find it very difficult to say that any one coach should be fired after couple crappy seasons. Let's look at the facts, by UCLA's Pomeroy rankings:

2004: 125
2005: 66
2006: 3 (lost to nat'l champs Florida in...the National Championship)
2007: 6 (lost to nat'l champs Florida in the Final Four)
2008: 3 (lost to nat'l runner-ups Memphis in the Final Four)
2009: 12 (crushed by Nova in the round of 32)
2010: 109
2011: 54

UCLA has most definitely had a down couple of years after having three of their best seasons in a long, long time. So let's look at this year:

2012 (so far): 
  • #93 Pomeroy 
  • Lost to #171 Loyola Marymount at home by 11
  • Lost to #112 Middle Tennessee at home by 20
  • Allowed 66.7% eFG against these teams
Allowing 66.7% from the field is in the bottom 20 in the country, and honestly is probably somewhat due to luck on Loyola/MTSU's parts. 

But with a moderately tough conference schedule and a home game against Texas soon, UCLA is in danger of starting out 1 and 3 against D-I opponents. Pomeroy's projections have the Bruins at under .500 in conference and under .500 overall. Scary times for Howland's squad, but given the talent I'm not all-too surprised. 

Bonus Claim #4: J'Covan Brown played an amazing game last night.
One of my roommates (who I will refer to as "Mur-Dog") just asked, "How good is J'Covan Brown?" So now I will tell you, offensively, how good his game was last night:

With an offensive rating of 157 on 29.5% of his team's possessions while on the court, against a slightly-better-than-average defense, J'Covan Brown's estimated offensive impact per 100 possessions was +20.7. Which on its own is better than any offense in the country (the highest adjusted offense is Ohio State, whose offense is roughly +18.8 better than average). Over the course of the game, he played 90% of the game, which boosted their offense by a total of +18.7 points per 100 possessions. DANG.

----

As soon as I reformat my hard drive (got my first PC virus in two years...), I will start discussing players by their overall (defensive + offensive) impacts. Hint: John Henson is sort of the best player in the country in his first two games. Color me surprised, offensively.

"My Team Should be #4, not #10!"

Howdy, folks.

Just thought you should know that we can demonstrate, mathematically, that there is little observable difference between teams in the top 25...er...top 32...er....top 15.

If the top 32 teams played .500 teams for 34 games, this would be their expected record (according to Ken Pomeroy's preseason numbers) :


RankTeamWins per 34
Losses per 34
1Kentucky331
2Ohio St.322
2North Carolina322
2Duke322
5Syracuse313
5Connecticut313
5Pittsburgh313
5Louisville313
9Vanderbilt304
9Wisconsin304
9Kansas304
9Florida304
9Temple304
9Missouri304
15Baylor295
15Xavier295
15Gonzaga295
15Nevada Las Vegas295
15Purdue295
15Memphis295
15Marquette295
15Michigan295
15St. Mary's295
15Michigan St.295
15Miami FL295
15West Virginia295
15Belmont295
15Florida St.295
15New Mexico295
15Texas295
15Texas A&M295


True, Texas A&M would very likely lose to Kentucky (giving Pomeroy's preseason ratings the benefit of the doubt here), but over the course of a season, there is little observable difference between the two (at least in terms of wins and losses). But given college games usually deviate from 10 to 12 points from the predicted point margin, it is even true that over the course of time, there is little observable difference between the 25th and 1st teams -- even to algorithmic ranking systems.

I say all this not to oppose ranking -- I love ranking teams and players. It's what I do. But to get up in a tizzy about who is #1 and who is #5 in rankings, especially pollster rankings, is honestly pointless (and honestly unknowable). Furthermore, as you get further and further from #1, teams become more and more close in skill level -- i.e. given accuracy of ratings, the difference between UK and OSU is significantly greater than the difference between UT and TA&M (a consequence proven by the central limit theorem).

So next time you want to bicker about the pollsters, take a step back and say: "The difference between team #4 and team #10 is actually quite small," over and over.

College Basketball Prospectus 2011-2012


It's out! I am very proud to be listed as a contributor on this book alongside some of my favorite sportswriters/statisticians/sportswrititicians.


Buy it here:
http://www.basketballprospectus.com/products/cbp2011/

!

Why John Henson Scares Me

EDIT: Hello, people from The Devil's Den. Aptly-titled! Just an FYI, I ran my NBA-style regression on these numbers (which I used to get extremely accurate numbers in the 2011 NBA finals) and Henson's "Roland Rating" here on offense honestly looks more like -1.5 than -17.5 when we adjust for randomness.

This is going to be a very short blog post. As a Tar Heel fan, John Henson scares the heck out of me.


Some of you who read this will scream out "PLUS MINUS IS FALLIBLE." And true, correlation does NOT imply causation. But this discrepancy appears to be very significant. Around 90% of Henson's on-court/off-court performance was tracked by StatSheet last season, and there are some interesting results.


The Heels seem to be about 3.2 points per 100 possessions better on defense with Henson on the floor.
Offense, on the other hand, is a very scary story, that I saw with my own eyes all season long:


(These are slightly estimated & rounded, based on UNC's average pace)


The Heels are nearly EIGHTEEN POINTS worse (per 100) on offense with Henson on the floor. Poor foul-shooting and over-shooting from inside the lane without passing to more efficient teammates are what appear to be the cause, just from watching.


Now, with this in mind, it might seem like the Heels would be worse with Henson (offensively) in every game, but that figure is more like 68% of the time. So this data at least suggests that there is maybe more to the picture than meets the eye.


I saw that Henson played miserably in his 11 minutes against William & Mary (who UNC ended up clobbering). So I removed unranked and non-ACC teams, and got the following:


So. Yeah. Any ideas?

Followers

About Me

I wish my heart were as often large as my hands.