For all your fancy-pants statistical needs.

Praise for The Basketball Distribution:

"...confusing." - CBS
"...quite the pun master." - ESPN

Win Shares per 48 Minutes versus Easy Player Ratings


Since Win-Shares per 48 minutes and my Easy Player Ratings use the exact same data (although EPR also adds minutes per game) to calculate player "efficiency," I thought I would compare the two.

I took all NBA players from in the 3-point era who played more than 1000 minutes and looked at their WS/48 and EPR values. From there, I just had a look at the top 100 in Win-Shares per 48.

Most notably, David Robinson (3.36 EPR) beats out Michael Jordan (3.27 EPR), barely -- this is somewhat intuitive, as Jordan's old years in Washington significantly decrease his "average," likely from his poor defensive numbers.


Now here are the 10 players in the top 100 who WS/48 comparatively likes the most:
PlayerFromToUSG%ORtgPoints Prod Per 100DRtgMPWS/48(rk)EPR(rk)difference
1Leon Powe2007201120.411523.4610313.90.174331.1788-55
2Steve Mix1980198321.711324.52110317.20.168391.1887-48
3Marcin Gortat2008201115.311617.74810217.20.162461.1789-43
4Steve Nash1997201121.211925.22811031.30.168391.2280-41
5Kevin Love2009201122.111725.85710929.80.163451.1986-41
6Mark Price1987199822.811626.44810929.90.158521.1493-41
7Ryan Anderson2009201120.711523.80510518.90.157531.0894-41
8Amir Johnson2006201114.312217.44610717.80.154610.8099-38
9Carl Landry2008201120.511723.98510824.90.155601.0495-35
10Todd MacCulloch2000200317.711320.00110015.40.166431.3274-31

Unfortunately, Steve Nash's lower usage and nearly non-existent defensive stats underrate him in EPR. Personally, I think Nash is in the top 5 offensive players of all time, which his usage and Offensive Rating do not capture well. Not sure where the rest of these guys fall - it could be because of low minutes-played, but that term is not worth all that much.


Here is a look at the players in the top 100 who the EPR system likes more than WS/48:


PlayerFromToUSG%ORtgPoints Prod Per 100DRtgMPWS/48(rk)EPR(rk)difference
1Patrick Ewing*198620022810629.689934.30.15771.832849
2Jack Sikma1980199120.911022.9910233.70.149821.584438
3Scottie Pippen*1988200422.510824.310234.90.146941.495737
4Eddie Jones1995200820.111122.31110334.40.147891.525336
5Dennis Rodman*1987200011.411412.99610031.70.15771.594235
6Horace Grant1988200415.211717.78410433.20.147891.515435
7Dikembe Mutombo199220091511116.659930.80.153691.723534
8Jeff Ruland1982199322.310924.30710233.40.149821.535131
9Dominique Wilkins*1983199930.311233.93610835.50.148851.456025
10Peja Stojakovic1999201121.511424.5110633.50.147891.416623

EPR likes moderately high usage at average offensive rating, which explains Ewing near the top. In my regression, Ewing's efficiency + usage is above the threshold of having negative (relative) impact. Not quite sure what to make of the rest.


At any rate, here is the entire list of the top 100 players by WS/48

PlayerFromToUSG%ORtgPoints Prod Per 100DRtgMPWS/48(rk)EPR(rk)
David Robinson*1990200326.211630.399634.7
0.251
3.361
Michael Jordan*1985200333.311839.2910338.3
0.251
3.272
LeBron James2004201131.811536.5710240.1
0.2274
2.943
Tim Duncan1998201127.811030.589535.8
0.2166
2.924
Larry Bird*1980199226.511530.4810138.4
0.20313
2.695
Chris Paul2006201123.812128.8010437.1
0.2333
2.676
Dirk Nowitzki199920112711731.5910336.5
0.2148
2.617
Karl Malone*1986200429.411333.2210137.2
0.20512
2.588
Magic Johnson*1980199622.312126.9810436.7
0.2255
2.539
Manu Ginobili2003201125.111528.879928.1
0.2148
2.5210
Shaquille O'Neal1993201129.511333.3410134.7
0.20811
2.4911
Yao Ming2003201126.811230.029932.5
0.214
2.4312
Dwight Howard2005201123.211125.759836
0.18819
2.4213
Charles Barkley*1985200024.811929.5110536.7
0.2166
2.3914
Kevin Garnett1996201125.211127.979936.7
0.19118
2.3915
Hakeem Olajuwon*1985200227.110829.279835.7
0.17730
2.2316
Arvydas Sabonis*1996200322.911225.659724.2
0.214
2.2317
Julius Erving*1980198726.911230.1310234.1
0.18222
2.0818
Dwyane Wade2004201132.511136.0810437.6
0.19316
2.0619
John Stockton*1985200318.912122.8710431.8
0.20910
2.0520
PlayerFromToUSG%ORtgPoints Prod Per 100DRtgMP
WS/48(rk)
EPR(rk)
Kareem Abdul-Jabbar*1980198924.211628.0710432.6
0.18222
2.0321
Pau Gasol2002201123.611527.1410435.9
0.17926
2.0022
Kobe Bryant1997201131.511235.2810536.4
0.18720
1.9723
Adrian Dantley*1980199126.812032.1611036
0.19217
1.9524
Shawn Marion2000201121.111123.4210136.3
0.16246
1.9125
Paul Pierce1999201127.811030.5810337
0.16741
1.8426
Sidney Moncrief1980199120.611924.5110530.2
0.18720
1.8327
Patrick Ewing*198620022810629.689934.3
0.1577
1.8328
Clyde Drexler*1984199825.411428.9610534.6
0.17334
1.8229
Moses Malone*198019952611429.6410533.5
0.17926
1.8230
Larry Nance1982199420.611623.9010433.4
0.17136
1.8131
Amare Stoudemire2003201126.911430.6710634.6
0.17730
1.7732
Kevin McHale*1981199322.411826.4310631
0.1824
1.7733
Alonzo Mourning1993200825.610827.6510031
0.16643
1.7434
Dikembe Mutombo199220091511116.659930.8
0.15369
1.7235
Brad Daugherty1987199422.211425.3110536.5
0.15656
1.7036
Reggie Miller1988200521.612126.1410934.3
0.17632
1.6837
Elton Brand200020112411126.6410436.9
0.15656
1.6438
Chauncey Billups199820112211825.9610732.3
0.17926
1.6439
Carlos Boozer2003201123.911126.5310332.6
0.15951
1.6340
PlayerFromToUSG%ORtgPoints Prod Per 100DRtgMP
WS/48(rk)
EPR(rk)
Chris Bosh2004201124.811328.0210636.9
0.1649
1.6241
Dennis Rodman*1987200011.411413.0010031.7
0.1577
1.5942
Greg Oden2009201019.711723.0510322.1
0.1824
1.5843
Jack Sikma1980199120.911022.9910233.7
0.14982
1.5844
Andrew Bynum2006201118.511721.6510324.3
0.17235
1.5745
Bob Lanier*198019842111223.5210228.1
0.16148
1.5746
Robert Parish*1980199721.211323.9610329
0.15753
1.5647
Andrei Kirilenko2002201118.911221.1710230.8
0.15656
1.5648
Artis Gilmore*1980198818.411921.9010630.9
0.16741
1.5449
Bobby Jones1980198617.111619.8410224.2
0.1737
1.5450
Jeff Ruland1982199322.310924.3110233.4
0.14982
1.5351
Kevin Durant2008201129.811133.0810738
0.15461
1.5352
Eddie Jones1995200820.111122.3110334.4
0.14789
1.5253
Horace Grant1988200415.211717.7810433.2
0.14789
1.5154
Dan Issel*1980198524.911829.3810929.9
0.1737
1.5055
Kermit Washington1980198815.911418.1310229.3
0.15461
1.5056
Scottie Pippen*1988200422.510824.3010234.9
0.14694
1.4957
Al Horford2008201117.511620.3010533.8
0.15461
1.4858
Kevin Johnson1988200022.611826.6710934.1
0.17829
1.4759
Dominique Wilkins*1983199930.311233.9410835.5
0.14885
1.4560
PlayerFromToUSG%ORtgPoints Prod Per 100DRtgMP
WS/48(rk)
EPR(rk)
Bill Laimbeer1981199416.911519.4410431.8
0.14982
1.4361
Ray Allen1997201124.511427.9310837
0.15461
1.4362
Joakim Noah2008201115.411517.7110226.2
0.1649
1.4263
Nene Hilario2003201118.111320.4510329.6
0.15272
1.4264
Blake Griffin2011201127.311130.3010738
0.15272
1.4165
Peja Stojakovic1999201121.511424.5110633.5
0.14789
1.4166
Tracy McGrady1998201129.610831.9710433.7
0.15461
1.4067
Shawn Kemp199020032510626.5010027.9
0.14789
1.3968
Brandon Roy2007201125.411629.4611035.6
0.15753
1.3769
Marques Johnson198019902411226.8810634
0.1577
1.3770
PlayerFromToUSG%ORtgPoints Prod Per 100DRtgMP
WS/48(rk)
EPR(rk)
Detlef Schrempf1986200120.311723.7510729.6
0.15656
1.3371
Paul Millsap2007201119.711422.4610426
0.15174
1.3272
Vince Carter199920112910931.6110636.4
0.14694
1.3273
Todd MacCulloch2000200317.711320.0010015.4
0.16643
1.3274
Mehmet Okur2003201121.611324.4110529.1
0.14694
1.3175
Scot Pollard1998200812.511414.259916.5
0.15369
1.2776
Cedric Maxwell1980198816.911819.9410628.7
0.15461
1.2777
Anderson Varejao2005201113.711515.7610224.7
0.15174
1.2678
Gary Payton1991200722.511124.9810635.3
0.14885
1.2479
Steve Nash1997201121.211925.2311031.3
0.16839
1.2280
PlayerFromToUSG%ORtgPoints Prod Per 100DRtgMP
WS/48(rk)
EPR(rk)
Jeff Hornacek1987200019.711723.0510831.5
0.15461
1.2181
Brad Miller1999201118.411420.9810528.6
0.1577
1.2082
Serge Ibaka2010201115.911518.2910322.8
0.15369
1.2083
Maurice Cheeks1980199315.411718.0210631.8
0.14694
1.1984
Calvin Natt1980199021.311424.2810731.4
0.14694
1.1985
Kevin Love2009201122.111725.8610929.8
0.16345
1.1986
Steve Mix1980198321.711324.5210317.2
0.16839
1.1887
Leon Powe2007201120.411523.4610313.9
0.17433
1.1788
Marcin Gortat2008201115.311617.7510217.2
0.16246
1.1789
Terrell Brandon1992200223.911026.2910529.8
0.14789
1.1590
David Lee200620111911722.2310831
0.14885
1.1491
Kevin Martin2005201124.711728.9011131.2
0.15174
1.1492
Mark Price1987199822.811626.4510929.9
0.15852
1.1493
Ryan Anderson2009201120.711523.8110518.9
0.15753
1.0894
Carl Landry2008201120.511723.9910824.9
0.15560
1.0495
Terry Porter1986200219.111521.9710727.8
0.1577
1.0196
Ricky Pierce198319982511629.0011024.4
0.14694
0.9697
Kiki Vandeweghe1981199323.611928.0811330.3
0.14885
0.9698
Amir Johnson2006201114.312217.4510717.8
0.15461
0.8099
Ty Lawson201020111911822.4211023.6
0.14694
0.69100

Easy Player Rating System!

As a basketball statistician, I am thoroughly obsessed with Jeremias Engalmann's Adjusted Plus-Minus numbers.
As a basketball fan, I realize that most people are hesitant to even attempt to understand what's going on in Adjusted Plus-Minus.

To combine the two worlds, I have looked at the latest four individual seasons of data, and I have compared advanced basketball stats with the Adjusted Plus-Minus numbers. By using four advanced stats (easily found at Basketball-Reference.com: per game, per season, or per-career), we can estimate how much a player impacts their team, per possession.

Here are the four statistics:

-Minutes per Game
-Offensive Rating (ORTG)
-Usage% (Possessions used)
-Defensive Rating (DRTG)

I made a regression of values to predict the Adjusted Plus-Minus, and averaged each season from 2008-2011 (with players having 500 minutes or more). The result is the following:

=(0.035 x Minutes/Game) + (0.43 x (Usage%/100) x Offensive Rating) - (0.14 x Defensive Rating) - (0.44 x Usage%) + 13.8

For Dwight Howard, this season, we get:
37.6 Minutes per game
27.2% Usage
113 Offensive Rating
94 Defensive Rating

=(0.035 x 37.6) + (0.43 x 0.272 x 113) - (0.14 x 94) - (0.44 x 27.2) + 13.8
=1.316 + 13.21648 - 13.16 - 11.968 + 13.8
=3.2        --- (although it's 3.45 if you use the more precise numbers below)

[For stat-heads, the actual coefficients are:  Min/G: 0.034853, ORTG*Usg/100: 0.434141, DRTG: -0.13995, USG%: -0.43613]


So for the 2010-2011 regular season, I have calculated the predicted "Net Efficiency." This is simply our estimate of how much a player adds to his team's point differential per 100 possessions of offense & 100 possessions of defense. Also, I have calculated the estimated "Wins Added" by multiplying their efficiency by the % of minutes they played, and converting that number into a wins estimate (how many wins an average team would have gained from their performance).

Here are the results for 2010-2011 (Regular Season - players with 500 or more minutes).

Updated Playoff Odds, 4/29

All first-round series except San Antonio/Memphis have been decided.

Serieses?


Easiest battle is Chicago over Atlanta in 5.
Closest series is the Los Angeles over Dallas in 6.

Not Exactly On Hiatus

Hello all!

I am currently finishing up my 8th semester at Appalachian State, and graduating in a couple of weeks.
I've been busy with non-basketball...or at least I've been attempting to be busy with non-basketball.

I'll be writing a bit for The Coolest Basketball Site (TM) this summer, which I am extremely excited about.


Anyways, here are my silly opinions on basketball as the playoffs begin:


-Nathan

Playoff Odds as of April 8th

I simulated the NBA playoffs, under a few assumptions.

1) Memphis makes the playoffs
2) There are no tie-breakers and teams are seeded according to conference standings
2) The regularized +/- 2011 numbers are accurate

(5:38p EST) - NEW RESULTS, updated with estimated playoff minutes

EDIT: A bit on the method.

I took all players who aren't out for the season, and converted their minutes into estimated playoff minutes (per DSMok1's suggestion), which I then had to adjust to force each team's game minutes to sum to 240 total minutes.

I then looked at each player's regularized +/- numbers, and gave them a contribution of Projected Minutes% * (Offense+Defense).

I then set the league average to zero, and each team was given their own "RAPM" rating. This was used to simulate the playoffs via a spreadsheet made by DSMok1 which I modified.

Dirk for MVP!

The boys over at the APBR metrics board are asking who should be MVP. I think that if we use the ridge-adjusted plus minus ratings, we can get a good answer.

I converted each player's worth into a total efficiency differential (Offensive RAPM times Minutes% for Offense, etc), then looked at how much worse we would expect their team to be without the player. I converted efficiency ratings into "pWins" or "pythagorean wins" by doing Offensive Rating^14/(ORTG^14 + DRTG^14).

HERE ARE THE RESULTS

My Lazy Lazy Lazy Lazy RPI

EDIT/UPDATE: I'm not very happy with the math here.

I have constructed a very lazy RPI, that is more theoretically sound than the RPI.


Considering the linear version of the Log5 win-percentage formula, we could (lazily) assume the following:


Season Win%= 0.5 + Real Win% - Opponent's Real Win%


Therefore:
1) Real Win% = Season Win% + Opponent's Real Win% - 0.5


and


2) Opponent's Real Win% = Opponent's Season Win% + Opponent's Opponent's Real Win% - 0.5


If we assume (lazily) that "opponent's opponents" play average (.500) teams, we can then also assume that their Season Win% equals their Season Win%, like so:


3) OOSeasonWin% = 0.5 + OORealWin% - .5
4) OOSeasonWin%=OORealWin%

So we can replace "Opponent's Opponent's Real Win%" in #2 with "Opponent's Opponent's Season Win%"

When we replace Opponent's Real Win% with #2, we get


5) Real Win% = Season Win% + (Opponent's Season Win% + Opponent's Opponent's Season Win% - 0.5 )-0.5
6) Real Win% = Season Win% + Opponent's Season Win% + Opponent's Opponent's Season Win% - 1


or as the RPI would have it,
RPI = WP + OWP + OOWP - 1


So in theory, Win%, Opponent Win%, and Opponent's Opponent Win% should all be weighted 'equally.'

Here We Go!!! (Into overtime!)

The (real) NCAA tournament starts in about one hour. To kick it off, I present my Overtime% for the first round.

Each game is ranked by the probability that is going into overtime*:

Here are the results


*The theoretical odds of going into overtime are lower than that of actually going into overtime**; there are a few specific things that have to happen to make the game sum to zero - the rankings are still valid though.

**End-of-40-minutes Game-scores fall under the normal distribution, but there is a significant dip around zero.

Updated Bracket Picks (Expected Wins)

I've updated the LRMC simulation to only include Clemson, and weaken BYU & Belmont (by the equivalent of 1 point per 100 possessions).

Here's the results.

For a bit of math - this method is pretty arbitrary in terms of assigning values - I just assumed this year's distribution of teams. I weakened BYU to better account for Davies' recent dismissal, and weakened Belmont, because....well....it just doesn't fit for them to be #4.

Top Final Fours

The majority of huge-pool winners accurately predict the Final Four...here is a sampling of the top (seven) possible final fours that my LRMC simulation predicts.


E W SW SE Probability
Ohio St. Duke Kansas Pittsburgh 4.04%
Ohio St. Duke Kansas BYU 3.42%
Ohio St. Duke Kansas Belmont 2.10%
Ohio St. SDSU Kansas Pittsburgh 1.81%
Ohio St. Duke Notre Dame Pittsburgh 1.51%
Washington Duke Kansas Pittsburgh 0.97%
Ohio St. Duke Purdue Pittsburgh 0.88%


If you're doing a multiple-bracket pool, this might be useful...updated simulation results coming soon.

Official Tournament Picks, CONTINUED....

Here are some more numbers to help you make your picks:

"EW" means expected wins ('opening' round not included).
-Overall odds in the original efficiency simulation

-Overall odds in the LRMC simulation

-Consistency values (for each tournament team) - higher means more inconsistent

I am currently running a new efficiency simulation that uses a different formula than before to predict Percent Chance of Win.

Also, here is a quick rundown by Dean Oliver on why slow-paced teams like Wisconsin increase their likelihood of losing to less efficient teams.

OFFICIAL Tournament Picks, VERSION ONE


This post is dedicated to my Mother, who wants my tournament picks :-D.

I have looked at every pick and noted its overall value in ESPN's tournament challenge.
Ohio St. winning the championship is the highest value not because they have a great chance of winning the championship, but putting them there


Here's the Spreadsheet (version 1, efficiency ratings)


For the mathematically inclined:

I used DSMok1's adjusted ratings and ran ~10,000 simulations of the bracket to find each team's odds of getting to each round.

Each round value = Sum of all Previous (Round Value * Odds of Winning That Round) + Round Value * Odds of Winning That Round.


Of note: these values did NOT include the probable home-court advantage (for example, UNC plays in Charlotte). I will add this soon if I feel its warranted.

S-Curve Madness: The Good, The Bad, and The Ugly

Wow, what a bracket. I'll be very quick here (forgive me if I miss something important), as I've got to get moving on my official predictions.

The good:

-Notre Dame didn't get a 1-seed (they didn't deserve one).
-St. Johns was a 6-seed (still a bit too over-seeded, but I'll take it).

The bad:
-Utah St, Clemson, Missouri, Gonzaga, Marquette are significantly better than their seeds suggest.
-Obviously, Virginia Tech not making the tournament is pretty ridiculous.
-Duke has the easiest path in the world until they will likely meet (#4 Pomeroy) Texas in the Sweet 16.

The ugly:

-As I disdainfully remarked on twitter, Belmont is seeded worse than ~THIRTY FOUR teams that have played worse than them, according to Ken Pomeroy's very reliable ratings. By adjusted efficiency, Belmont is #18 and Wisconsin #9. By adjusted margin of victory, they are #20 and #11. By genius-math-hyper-accurate-point-margin, they are #4 and #12. Ugh.

-Carolina vs. Washington is a very similar matchup, if they both go to the round of 32. Pomeroy has UNC at #14, Washington at #15. LRMC has UNC at #15 and Washington at #8. And Raymond has UNC at #14, Wash. at #7.


Alright, I'll keep everyone posted. Let's go Georgia!

The Humans are a Little Too Impressed...

As it gets down to crunch time for the teams who are on the bubble, and as the 68-team-field will be together in under 100 hours, I present to you a quick summary of the teams that impress pollsters, but not computer ratings.

"The Computers Aren't As Impressed"

Notre Dame: #4 AP, #4 Coaches, #15 Pomeroy
Now statistically, we can't really be sure of where a team's true value lies any better than +/- ten places or so, but currently Notre Dame's good record comes from winning close games (13th in 'Luck'). I would be relatively surprised if Notre Dame made it to the final four, although they have a decent chance of getting a #1 seed.

Arizona: #16 AP, #15 Coaches, #28 Pomeroy
Again, Arizona is good, but they're not that good. Many of their wins include single-digit-victory home games.

St. Johns: #17 AP, #18 Coaches, #34 Pomeroy
Inconsistency is the key here. Pollsters (and everyone) is impressed with wins against West Virginia, Georgetown, Notre Dame, Duke, Connecticut, Cincinnati, Marquette, Pittsburgh, and Villanova. While many of those wins came closely at home, this still is a huge sample of good performance against good teams. This St. John's squad has also lost to St. Bonaventure at home, Fordham on the road, Seton Hall on the road (by 14!). Their six Big East losses have come at an average of 14.7 points. Ouch.

Xavier: #18 AP, #20 Coaches, #35 Pomeroy
Xavier has definitely improved. After only beating Western Michigan by 3 at home, going into overtime with IUPUI Ft. Wayne at home, and losing to Miami OH on the road by eleven, they have won 16 of their last 17. The computers are not impressed, however, by the mediocre schedule those 16 wins came against. The one loss in that stretch? To #207-Pomeroy Charlotte.

Temple: #24 AP, #25 Coaches, #38 Pomeroy
Again, the pollsters just felt like boosting up a mid-major with lots of wins. While Temple beat Maryland and Georgetown, they don't have anything particularly great on their resume (the Georgetown win came at home, and was only by 3). Temple has mostly been feeding off their weak conference to get here.

That's all for now. Selection Sunday and bracket simulations coming soon!

Unranked Lurkers

There are several teams who simultaneously impress statistical rankings, but do not impress poll-rankings.

Here are all the teams who are in the top-25 of at least one of my three favorite systems --and not ranked in either major poll--: by Ken Pomeroy's efficiency margin, Raymond's Ratings (basically SRS, if you're familiar), and GA Tech's Bayesian Logistic Regression Markov Chain.

Top-25, The-Humans-Are-Unimpressed
(bold indicates a computer system being similarly unimpressed, italics indicate top-10 computer rating)


-Washington (P10, 19-9) - #13 Pomeroy, #8 Raymond, #6 LRMC

Washington has had a particularly tough time away from home, losing two of three on neutral courts (by single digits to Kentucky and Michigan State), and losing six of eleven on the road (only once by double-digits). At home, on the other hand, the Huskies won their first thirteen before putting up a non-characteristic eFG% of 39.7 against Washington St. on Sunday, losing by eleven. Their blowout wins prove a marked inconsistency, as they absolutely beat up on decent teams. Washington beat top-100 Pomeroy teams Oregon, Long Beach St, Arizona, UCLA, USC, Cal (twice), and Stanford, by an average of 18.4 points. I won't give up on them (as Pomeroy similarly encourages you to do) because of this, and their demolishing of Arizona and their quality road performance at UCLA.

-Maryland (ACC, 18-11) - #16 Pomeroy, #16 Raymond, #32 LRMC

Four of these losses include: An 8-point road loss at Duke, an 11-point road loss at Carolina, a 9-point neutral loss to Pittsburgh, and 8-point road loss to Villanova. Their overall strength of schedule is low since 1/3 of their season has been against sub-200 teams. This is evident in the extremely flawed RPI, who knocks Maryland down to #83. Ouch. If these guys win the ACC tourney, I would expect them to win a couple in the big dance...but the odds are not in their favor to get that first step.

-West Virginia (BE, 18-10) - #18 Pomeroy, #18 Raymond, #19 LRMC

Exactly half of WVU's ten losses have come against top-25 Pomeroy teams, and they have wins against Vanderbilt, Cincinnati, Purdue, and Notre Dame. Their Pomeroy strength of schedule, as one might expect, is 2nd in the country.

-Belmont (ASun, 27-4) - #20 Pomeroy, #24 Raymond, #8 LRMC

Belmont is an interesting case. We have a very low sample size of decent competition with these guys - they've only played three games against tougher opponents than #106-Pomeroy East Tennessee St. In fact, only eleven of their thirty-one games have been against top-200 Pomeroy teams. At any rate, their only losses have come against decent opponents (save Lipscomb), on the road, by an average of only seven points.

-Illinois (B10, 18-11) - #21 Pomeroy, #22 Raymond, #20 LRMC

The Illini have been extremely inconsistent this season. While they have lost to Illinois-Chicago on a neutral court, they beat tough opponents in Maryland, Wisconsin, Gonzaga, and North Carolina. Also, they've had to deal with the nation's 6th-highest string of opponents (by Pomeroy's metric).

-Cincinnati (BE, 22-7) - #24 Pomeroy, #28 Raymond, #34 LRMC

Cinci is at least somewhat recognized by humans, as they received the 32nd most votes in the AP poll this week. Their seven losses have come from teams with an average ranking of 19-Pomeroy.

-Marquette (BE, 18-11) - #25 Pomeroy, #26 Raymond, #27 LRMC

Marquette has had an unfortunate schedule. They've lost to neutral-court Duke by 5, road-Pittsburgh by 8, road-Lousville by 1, road-Nova by 5, road-Notre Dame by 5, and road Georgetown by 9. While the humans might not be impressed, just from those numbers alone, a statistical-minded Nathan Walker would call Marquette a top-25 team.

-St. Mary's (WCC, 23-7) - #45 Pomeroy, #32 Raymond, #23 LRMC

St. Mary's inconsistency is marked by a high-high and a very-low-low. They only lost to BYU by 1 on a Neutral court, but lost to #302 Pomeroy San Diego. In between has come a few losses to good teams and beating up every other average team they encountered.

Unfortunately, some of these squads are going to be Nationally Invited, if you know what I mean. For those that make the big dance, there's a good chance they'll beat their better-seeded opponent.

Offensive Decision% version 2

I've updated my Offensive Decision% formula to include Offensive Rebounds. A field goal attempt is now only considered one 'decision' if the player does not rebound the attempt. So the denominator now subtracts Offensive Rebounds x Shot% in an estimation of how many offensive rebounds a player makes on their own missed field goals. Here's the entire formula:


Here are the current results for the NBA, with those playing 500 minutes or more.

NCAA team offensive efficiency impacts

I have previously done work on estimating how much statistics (specifically, the Four Factors + 2 more) impact efficiency. My prior method was lazy and inaccurate at adjusting for Strength of Schedule. The new method adjusts each factor rating differently. For the math, scroll to the bottom* EDIT: Yes, the total numbers do not EXACTLY equal (Adjusted Offensive Rating - League Average Offensive Rating), but they are close (R^2 of .99, to be concise).


But here's what you really want.
NCAA adjusted offensive four factors


*The original method took (Deductive Efficiency - Deduced efficiency with league average stat) and multiplied this by (Adjusted Efficiency / Raw Efficiency). The new method is a little more complex. I found out that each stat didn't impact efficiency as much as I thought, since each factor interacts with one another. I found the following:

While predicting change in efficiency (minus average), the following weights occur: eFG&FG+=1.065833, TO%+=1.088916, OR%+=0.935664, FTR&FT+=0.38507

Each individual output would have to be multiplied by these coefficients. However, I still needed to adjust for strength of schedule. To do this, I subtracted Adjusted - Raw Offense for each team to get their Schedule Adjustment Factor. I then weighed each of the four factors so that they would sum to one (fg=
0.306672, to=0.313314, or=0.269218,ft= 0.110796). Here's an example of how eFG%&FG% look:

eFG&FG+=1.065833 * [(Deduced Efficiency - Deduced efficiency with average eFG% and FG%) + .306672*Schedule Adjustment ]

NCAA player offensive ratings

Just put together another round of player offensive ratings - data via KenPom.com. It adjusts for quality of defense and usage% - the final number is an estimate of how efficient an average team's offense would be with the player on the court.

Here's the results

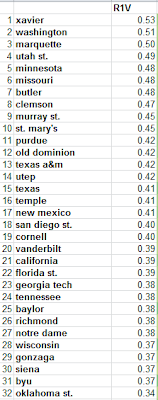
2010 Tourney "All-or-nothing" Ratings

This is using my pre-tournament LRMC simulation from last year. See my last blog post for the method,. I still haven't come up with a good name for it.
How does "effective likelihood of doing better than statistically expected" sound?

here's the first, second and third (r1, r2, and r3)


The first-round component gives us the most meaningful information (as the later rounds heavily favor better teams). Let's take a look at the results:

1) Xavier: as a 6-seed, beat 11-seed Minnesota and 3-seed Pittsburgh
2) Washington: as an 11-seed, beat 6-seed Marquette and 3-seed New Mexico
3) Marquette: lost to the (more-volatile) Washington
4) Utah St: lost to Texas A&M (who was just 0.07 lower in volatility)
5) Minnesota: lost to (highest-volatility) Xavier

other notables: the official Cinderella of 2010, Butler, was #7 (volatility of 0.48). Also, Cornell (who beat the 5 & 4 east seeds as a 12-seed), was ranked 19, with 0.4.

On to the second round:

1) West Virginia: made it to the Final-Four as a two-seed.
2) BYU: fell to Kansas St, who was 5th in volatility
3) Duke: Won the tournament...
4) Kentucky: Didn't make it past West Virginia, but succeeded as a (statistically) overrated team
5) Kansas St: Fell to Butler in the Elite 8 - pulled through in a pretty tough bracket though (statistically)

other notables: Butler is the highest-ranked 5-seed in 2nd-round volatility.

The third round doesn't tell us much new information, although Duke is the highest-ranked team here (in a bracket that statistically favored Kansas).

Anyways, the information here is hard to quantify, but I think some important things can be learned, especially from the first-round component!

Team Volatility

This is going to be a shortish post considering the amount of new analysis I'm introducing, but I would like to start offering some tools to help predict even the strangest of occurrences. For example, it would have been statistical folly to predict Northern Iowa or Cornell to win as many games as they did in 2010; I want to predict the next Cornell!

So let's go in order of depth.
First, basic probabilities: teamrankings.com has some phenomenal pre-selection simulation projections for the tournament, giving individual probabilities for each team making it to round X.

From these we can find AVERAGE PROJECTED WINS: simply sum together each of the 6 probabilities to find the mean-expected wins each team will have in the tournament.
From this, we can do some theory: given that team x wins at least y games, how many wins will they THEN be projected to have; I call this "Average Projected Wins with X games secure." This would be estimated like so:

=Y games won + sum(probabilities of the rest of the tournament)/(probability of winning Y games)

So for two games secure, the math would be:

=2 + sum(probabilities of winning the 3rd,4th,5th, and 6th games)/probability of winning in the second round)

From this, we can get a hybrid statistic, that I like to call Volatility: this is the marginal wins gained from winning any specific round of the tournament, TIMES the probability of winning that round. We do this by subtracting "X games secure" from our starting average (zero games secure).
For example, one team's volatility in the first round would be:
=[(2-win secure average wins) -( 0-wins secure average wins)] * odds of winning those first two games

The first three rounds are the ones that tell us the most information, l
ater rounds are skewed by higher-quality teams having much higher odds of winning the games beforehand. On the right are the top ten teams by "first round volatility," considering the projected fielding of teams.

This tells us, roughly, which team will benefit the most if they can overcome early obstacles. A better utilization of this method would be to subtract from the ESPN National Bracket "average wins" rather than my statistical "zero wins secure average." This gives us a better picture of which team will do better than expected by most, and therefore, which team will help you destroy everyone in your office pool!

Offensive Decision%

Finally, some good old fashioned statistics that don't have really good theory behind them!
Often-times, when I'm watching a basketball game, I mentally determine who is making the most good decisions and the most bad decisions on offense.

So here's a basic metric of what my eyes see, and I call it Offensive Decision %. It basically measures, poorly, Good Offensive Decisions / Total Offensive Decisions.

=(FGM + Assists + .44 * FTM) / (FGA + Assists + TO + .44 * FTA)

And here's the top NBA players (as of earlier this week) with median minutes played or more.

Estimated defensive rating formula, with Usage% !

EDIT/UPDATE: This formula, like Dean Oliver's is based on some good theory, but as I have examined it more, it is a very poor measure of defensive success. If you need a quick fix, the following explains player defense better than the formula described:

(Points Allowed On Court / Possessions Played) - (Points Allowed Off Court / Possession Off-Court)


Woo! This one took a lot of work, but I think I have all of the theoretical errors taken care of. It's very similar to Dean Oliver's box-scoreformula, but with a few important adjustments:

-'Points allowed' are assigned individually based on estimated output per possession in units of 0, 1, 2, and 3, based on Ryan Parker's bachelor essay (Rather than only assigning players Stop values that add a marginal 'DefensivePointsPerScoringPossession' per stop)


-For each possession-allowed (0,1,2, and 3), we both estimate (via blocks, defensive rebounds, turnovers, and player fouls) the effectiveness of the player's defense, but also more intuitively adjust for our unknowns (most importantly, non-block-forced-field-goal-misses). This allows us to not rely on shoving 100% of the Team Defensive Rating into the final step of the formula.


-Defensive possessions used are calculated by the marginal-used-possessions from our estimates; The base rating still lies close to 20%, but is modified only in part by blocks/stls/pf/dr.

This is for college ball, since that's where Ryan's estimates of possession-endings come from; however, the forced free throws come from my NBA-team-estimate (which is pretty lazy currently).

quick definitions for the uninformed:
DFG% = opponent's Field Goals Made / opponent's Field Goal Attempts
DOR% = opponents Offensive Rebounds / (opp. off. reb + team def. reb)
PF=player personal fouls
dFTA = Free Throw Attempts by opponents
tmBlk = (team)blocks
DR = player defensive rebounds
dFT%=opponent's Free Throws Made / opponent's Free Throw Attempts
dFGA=opp's field goal attempts
dFGM=opp's field goals made
d3PM=opp's made three pointers
Stl = player steals
Poss = team possessions, as estimated here

Let the math begin!
tMin% (team minute %)= .2 * minutes / game minutes = minutes / team minutes
(this is our basic estimate of player defensive involvement for the whole game in places where we can't assume otherwise)

PossPI (possessions played in)= Team Possessions * tMin% * 5

FMW (forced-miss-weight) = (dfg%*(1-dor%)) / (dfg%*(1-dor%)+(1-dfg%)*dor%)
(same as Dean Oliver's formula - distributes credit of missed field goal to the one guarding and the one getting the defensive rebound. Guarding man gets FMW, defensive rebounder gets 1-FMW).

eFFTA (estimated forced free-throw-attempts) = (.6033*PF^1.2132)
(This is the basic team-level estimate I got from the NBA)

FFTA (forced free-throw-attempts) = uafFTA * (dFTA/team's Sum of(uafFTA))
(This forces the prior number to make the total forced free throw attempts equal to the actual free throw attempts)

FMstops (stops from forced misses)=(Blk + .tMin%*(dFGA-dFGM-tmBLK))*FMW*(1-dOR%) + DR*(1-FMW)


(Defensive rebounds are worth 1-FMW, blocks are worth 1*FMW, and we estimate that all other DFG% can be distributed equally. My NBA-team data showed zero correlation between Blocks and Non-Blocked-Field-Goal-Misses).

0pdp (zero-points-defensive possession)
=FMstops + .27*(fFTA-fFTA*dFT%) + Stl + tMin%(dTO-tmStl)

(Gives each player full credit for their steal, and then distributes all other turnovers equally. NBA team data also seemed to show no correlation between Steals and Non-Steal-Turnovers. This, like the rest of the 'pdp' formulas is based off the possession-ending-estimates in Parker's bachelor essay.)

1pdp
=.35*FFTA - .25*fFTA*dFT%

2pdp
=.95*tMin%(dFGM-d3PM+(tmBlk-Blk)) - Blk +.36*FFTA*dFT%

This spreads out 2-pointers made between all-players, but trades out the appropriate credit for blocks. This might look a little counter-intuitive, so I might talk a bit more about this in comments or a later post. Also, we assume that each player only blocks 2-pointers.

3pdp
=tMin%*(d3PM+.02*(dFGM-d3PM)) +.03*FFTA*dFT%

dPA=1pdp + 2*2pdp + 3*3pdp
(Defensive points allowed. 1 for 1-point possessions, etc)
dPOSS=0pdp + 1pdp + 2pdp + 3pdp
(Total defensive-possessions the player is credited for ending.)

DRTG=100*(dPA/dPOSS)
dUSG%=dPOSS/dPossPI

Whew!
Here the formula is in action (from Saturday's Carolina game):


Edit: If you're wondering how effective this really is, check out the ratings applied to NBA players with median minutes or more, and converted the ratings to defensive win shares. Compare this with basketball-reference's 2010-2011 season by Defensive Win Shares.

Losing Larry Drew II

EDIT: I accidentally named Strickland in the paragraph on defensive plus-minus rather than Drew. Now fixed.

The North Carolina Tar Heels just lost Larry Drew II, transferring after playing some pretty decent basketball (according to that article).

Let's take a moment and look at Larry Drew's estimated offensive impact.

Using 15% of the Tar Heels' possessions for 57.5% of each game, with their lowest Offensive Rating, I estimate that losing Drew will bring Carolina's 'Raw' Offensive Efficiency up to 107.88 (from 106.45). Depending on how you look at it, Drew's absence would add between 1.4 and 1.5 points per 100 possessions to Carolina's 'Adjusted Offensive Rating'.*

Also, I ran StatSheet's plus-minus data and found that (weighted by minutes played) while Drew was on the court, Carolina averaged a point margin of 2.3 per 40 minutes. With his replacement point guards on the court, they averaged 10.8 points per 40 minutes. To this effect, Drew's on-court presence hurt Carolina by 8.5 points per 40 minutes.

But Larry Drew's main claim to fame was his defensive prowess. There are no truly good defensive stats for players like Drew, but we have to assume that he contributed some to Carolina's defense. Let's try to take a closer look:

Some quick stats from his Pomeroy page: I'll rank him among the three players who run point the most (Marshall, Strickland, and Drew).

Defensive Rebound%: Drew takes the lead at 9.3%, in close second is Strickland's 8.7%. Marshall isn't far behind at 7.4%
Block%: Ha! Marshall is the only one recording noticeable blocks, with 0.3%.
Steal%: Drew posts an impressive 2.7, but Strickland and Marshall have him beat at 3.1 and
Fouls Committed per 40: While fouling helps in some situations, Carolina's best Four-Factor stat is how few times their opponent gets to the line. This will likely only improve, as Drew's
modest 3.4 is bested by Marshall's 2.3 and Strickland's 2.6.
Defensive Plus Minus: Not going to rank players (takes too long to get these numbers), but with Drew on the court, Carolina allowed 40.9 points per 40 minutes. Off the court, Carolina allowed only 28.0 points per 40 minutes. That means that with Drew on the floor, Carolina did 12.9 points per 40 worse on defense.

It's never a very good idea to only use plus minus when looking at players, but NET +/- can tell us some reasonably accurate things about the effect of substituting players. As long as Carolina can emotionally push through this, losing Drew could actually win them an extra game or two. I just pray that the boys stay out of foul trouble and don't get fatigued now that a lot of minutes have to be filled.

Furthermore, I think that I would personally stick with Strickland, not Marshall. While Marshall posts an insane assist rate of 42.8 (compared to Strickland's 12.6), I'll take Strickland's TO% of 18.4 over Marshall's sloppy 32.9 any day.

That is all!


*One way of adjusting is just adding the 1.4 to the raw numbers. But if I use the ratio of UNC's Adjusted Efficiency to Actual Efficiency (1.034), the impact goes from -1.43 to -1.47.


NCAA Love...or How I Learned To Keep Worrying About Maryland Not Making It...

The following my listing of projected NCAA seed (from RPIforecast.com) versus LRMC seed (LRMC ranking + .75):


NCAAlove.PDF


Maryland still gets the short end of the stick, and Oklahoma St. gets too much love.

Saving My Beloved FG% from Death...

I am constantly frustrated by the current basketball community's lack of love for FG%. In Pomeroy's analysis, he looked at a very small sample of just one team. But I think it can be argued that FG% is still an important metric for two things: discussion of NBA players and of possessions.

First, a quick numerical analysis:

I took the top 310 or so NBA players and looked at how 'underrated' they are by their FG%. If we just look at the difference between eFG% and FG% we see that nearly 40% of players are underrated by 5% or more. But this is only a small part of the picture. Nobody who eyeballs the FG% of a guard thinks that a player is only shooting two-pointers. So I set up a regression for estimating eFG% via FG%. This allows us to look closer at the difference in 'roughly-expected' eFG% and eFG% itself.

Done this way, only about 10% of these players are off by 5% or more. If we get rid of the 'overrated players' (we assume that people aren't going to overrate a player's FG% in their minds), that drops to 7.7%. So at least on the player level, it's reasonable to say that FG% is pretty good for eyeballing efficiency via shooting.

Still unconvinced? Here's some more pudding:

1) FG% is useful for discussing Rebound%. To compare one team's eFG% to their OR% is not as intuitive as comparing with FG%. Field goal percent gives a better picture of 'possible rebounds' than eFG%.

2) In the same vein, FG% is more important in the discussion and analysis of what ends possessions and what doesn't.

3) I will maintain that the three-point-shot is harder to repeat. I have not done any analysis on this, but the theory is sound: the more difficult the shot, the harder it is to repeat. Therefore, to some degree, I would estimate that year-to-year FG% is a better predictor of out-of-sample eFG% than eFG% itself.

4) At least in the NBA, extremely high eFG% by a player is more likely to be from a big man; so in extreme cases of 'shooting well from the field', (which are often the important points of study), FG% is usually sufficient.


I know that none of this takes care of the two basic arguments against FG%: worse correlation with offensive efficiency, and 'just add .5*3pm from the box score!').


To that I say:

'Hey, eFG% isn't even really a percentage! It's just easier to type than Field Goal Points / (FGA * 2). I like my percentages to be out of 100, thank you!'

Below and Above The Bubble

Here are the 15 teams that reside just below the bubble for the NCAA tournament according to rpiforecast.com.

(at large rank) Team, Conf., LRMC rank

(#50) Florida St., ACC, #37
(#51) Maryland, ACC, #22
(#52) Virginia Tech, ACC, #40
(#53) Gonzaga, WCC, #39
(#54) UTEP, CUSA, #62
(#55) Richmond, A10, #51
(#56) UCLA, P10, #60
(#57) Southern Miss, CUSA, #75
(#58) UAB, CUSA, #73
(#59) Duquesne, A10, #30
(#60) Miami FL, ACC, #66
(#61) Clemson, ACC, #55
(#62) Old Dominion, CAA, #72
(#63) Marshall, CUSA, #67
(#64) South Carolina, SEC, #97
(#65) Penn St., B10, #69

This is looking pretty bad for those top ACC teams - the three right below Duke, Carolina, and Boston College in at-large probability. The biggest travesty here is obviously Maryland, who is #22 in the LRMC and #14 in Pomeroy. However, if they sustain their impressive defensive efficiency, win @ Boston College, and end up with 21 wins (as Pomeroy's numbers expect), I think they'll make it in.

Now let's look at the other end of the spectrum (the last 15 in):

(#49) Northwestern, B10, #38
(#48) Butler, Horz., #31
(#47) Colorado St., MWC, #68
(#46) Georgia, SEC, #54
(#45) Xavier, A10, #78
(#44) Washington St., P10, #34
(#43) Temple, A10, #33
(#42) Central Florida, CUSA, #56
(#41) Boston College, ACC, #52
(#40) Colorado, B12, #57
(#39) Iowa St., B12, #35
(#38) St. Mary's, WCC, #15
(#37) Arizona, P10, #21
(#36) Utah St., WAC, #43
(#35) Marquette, BE, #20

Xavier grabbing an at-large bid as the #78 team makes me shudder, but what can you do.

Trade Amare??

pdf - Player Trades that would Maximize Team Wins for the last half of the season.

corresponding messy excel sheet


EDIT: I forgot to to the 'trade' itself in Excel. It assumes that an average player would affect each team the same way. Amare is the biggest name on the 'both-sides-win' top 15 players. Not Kobe Bryant.

There are only a handful of players who, by trading, increase the value of both teams. This is an application of Simpson's Paradox.

The main math involved is roughly based on 'impact' value (which I have outlined earlier) in tandem with expected wins added, where I converted team efficiency margin into wins. (Every efficiency margin increase per 100 possessions is worth roughly 2.5 wins).

Overrated/Underrated NCAA teams

Overrated / Underrated Teams, ranked by average difference in Humans (avg AP & ESPN polls) and Computers (average LRMC and Ken Pomeroy rankings).

https://dl.dropbox.com/u/241759/overrated.html


Note: Teams not getting votes in either poll are given an arbitrary ranking of 45. Teams getting votes but not making the top 25 get a value of 36.

Theoretically Correct RPI!

Firstly, sorry for the lack of updates. I've had a lot of personal projects in other areas that I've been working on lately. But don't worry, MVP ratings, team ratings, etc, will all be coming back soon.

For now, here's my formula for the 'theoretically correct RPI.' The NCAA uses weights that are somewhat intuitive, but also provably arbitrary/random. So without further ado, let's examine how to get the most accurate "Real Win%" from three values: Win%, Opponents' Win%, and Opponents' Opponents' Win%. This will give us an over and underrated ranking, and tell us which teams, by the NCAA's logic alone, get the short end of the at-large-bid-stick.

Using the same math behind my simple adjusted rebound percent, we will work backwards to accurately represent the three variables involved in the RPI.

first:
B2(Opponents' Real Win%)=A1*B1/(1-A1-B1+2*A1*B1)
where A1=opponents' raw win% and B1=opponents' opponents raw win%

A3(Team's Real Win%) = A2*B2/(1-A2-B2+2*A2*B2)
where A2=raw team win%, and B2=opponents' real win%


I'll do some data mining to get this data officially for all NCAA teams soon, adjusted for home/away...skipping the first step in this equation makes for some strange results. One caveat of this formula is that all 0% and 100% teams remain that way (i.e. Kansas gets the same value as San Diego St.) More soon!

Player Offensive Efficiency

EDIT: I fixed the strength of schedule-adjustment.

Sorry, no team analysis today. Too few games have been played for me to feel comfortable analyzing with variance or a multivariate regression.

Instead, here's a quick peek at the formula by which players will be rated (offensively) on my new site (coming soon!)

Adjusted Player Offensive Rating =
Poss% x (ORTG x LeagueAverage)/(player's team SOS of oppD)
+ (1-Poss%) x LeagueAvgEfficiency

This basically shows how an average team would benefit (offensively) by replacing one of their players with the player in question. However, most of the values will be very close to the league average (I assume), so we will use a Net value to better isolate the player's value.

Net Offensive Rating =
Adjusted Player Offensive Rating - LeagueAvgEfficiency


I will hopefully soon do the same with defensive rating, although Ken Pomeroy does not calculate these. I'll have to improvise.


EDIT: Fixed the system. Kyle Irving posts an 8.8 instead of a 12.3
Stay tuned.

Quick note on Four Factors

If you look at the data from the NCAA four factors analysis (in my prior posts and in David Hess' posts) you might be thinking, correctly:

"This data explains where a team's points come from, but does not explain precisely how they could improve."

Then someone might respond:

"Now wait a second, doesn't this tell us how a team could improve? I mean, all Michigan State needs to do is take better care of the ball to win their games; the numbers say so!"

While the above answer is correct, it is important to realize that most teams don't have data points in Four-Factors ratings as striking as Michigan State's poor ball-handling.


What I will suggest is a continuation of what I have done in the past: figuring out how variable a team's factors are, and what causes this. For example, one might assume that a team thriving off 3-pointers (cough *Northwestern*) has much more variability in predicting offensive rating than one who thrives off 2-pointers, under the old adage, "si on vie par le trois, on mort par le trois." And I suppose it would make more sense to say that we can predict how a team's overall efficiency decreases against certain opponents via Four-Factor regression of individual games*.


Coming soon! (Gotta finish exams first...)


* By this I mean to run a linear/logistic regression to see how much an opponent's factors influence the team's factors.

Team Impacts, Part Deux

I know I haven't recently been naming any teams, any players, or any specific cases...be patient!


Per David Hess's suggestion, I am now adjusting in an 'error-free' and strength-of-schedule-adjusted environment. To do this, we plug in a team's statistical offensive efficiency (different from the regression model)

St.Offense=(avgFGpoints + avgFTpoints)/avgPoss

This one has a lower error than the model since it includes FT% and raw FG%. The only error involved in the equation comes from rounding , miscalculated possessions, and lack of adjustment for 'team' rebounds. So instead of comparing regressed efficiencies with actual efficiencies, I compare statistical offense minus same with the league average replaced for a certain Factor. However, the factors are labeled differently this time around per the deduced equation.

1) FG% and eFG% (eFG% does not accurately count missed vs. made shots)
2) TO%
3) OR%
2) FT% and FTR% (FTR does not accurately count made free throws)

However, I adjust this for estimated strength of schedule (Adj Factor = Adj. Offense / St. Offense) to more accurately represent how the team plays.

So the end result is:
Impact of factor(s)=Adj.Offense - [St.Offense with factor(s) replaced with average]*Adj.Factor

Here's the results in HTML and editable/searchable Excel format.

NCAA Four-Factor Impact

Lots of credit here goes to David Hess (aka @AudacityOfHoops) for his work on a simple estimation of how turnover effect efficiency. Check out his pretty blog!

Given the limitations of that formula, I decided to take it a step further: how much does EACH four factor affect a team's offensive performance? Because every time I check out Ken Pomeroy's team four factors I want to better-quantify those green-or-red bits of data.

I've come up with a way to quantify how deviation of the league-mean by each team's four-factors affects their overall offensive efficiency.

The same can easily be done for defense, but for right now, I'm just going to focus on offense:
WARNING: BORING MATH
I took a regression (which myself and David have done before) of the four factors on offensive efficiency. For each team, I took their four factors, save for the one in question, and multiplied them by the regression estimates. I replaced the one in question with the league average. Finally, I took their raw offense and subtracted this number from it. This gives us an estimate of how a team's deviation from the mean affects their overall offense, in terms of the Four Factors.
/BORING MATH

Here's the great news:
1) I made an Excel spreadsheet so you can easily plug this in for any team without having to scour for them (just enter the team under "Team")
2) I used the same color scheme as Ken Pomeroy's numbers :)
2) I also made a PDF for those who don't want to use Excel.

Editable Excel File

PDF File

Offensive Impacts

EDIT/UPDATE: This old formula has some truth to it, but I have a much more accurate method of describing this, as described in the College Basketball Prospectus 2011-201 book.

There's a very simple stat that estimates how much a player affects their team's overall offensive rating, using Dean Oliver's Individual Offensive Rating (as is posted for all teams' significant players on Kenpom.com)

Formula for offensive impact =
team ORTG - (team ORTG-(%poss*%min*ORTG))/(1-%poss*%min)


(Which estimates the impact a player has on his team's overall Offensive Rating)

Here it is for UNC and Duke:


North

Carolina
player %Min ORtg %Poss offensive

impact
Tyler Zeller 69.4 119.2 23.4 3.93
Reggie Bullock 32.2 106.3 20.7 0.54
Justin Watts 29.4 106.1 14.8 0.34
Leslie McDonald 35.3 97.7 18.7 -0.06
Kendall Marshall 35.9 95.5 19.2 -0.23
Harrison Barnes 69.4 96.8 22.9 -0.34
Justin Knox 37.2 93.9 24 -0.46
Dexter Strickland 62.8 93.7 17 -0.58
John Henson 61.6 94.6 25.5 -0.74
Larry Drew 63.8 76.8 14.6 -2.21
Duke player %Min ORtg %Poss offensive impact
Kyrie Irving 72.2 128.8 25.2 3.12
Andre Dawkins 57.8 144.3 13.2 2.44
Seth Curry 44.1 117.3 18 0.22
Ryan Kelly 35.9 116 13.5 0.07
Tyler Thornton 12.8 88.7 13.3 -0.45
Nolan Smith 76.6 113 27.5 -0.45
Josh Hairston 14.4 90.5 13 -0.46
Kyle Singler 78.8 112.1 21.2 -0.52
Miles Plumlee 36.6 90.3 17.8 -1.69
Mason Plumlee 66.3 101.6 21 -2.11


Now these stats don't exactly compare (a player with a +2 on a bad team is not as good as a player with +2 on a good team) - but this allows you to estimate what current substitutions do for a team, offensively (per 100 possessions).

100th post, and a recap of my latest tweets....

100th post!
Hoorah! This blog and twitter have given me a wee voice with which to share the math that runs through my head. Holla to my loyal few!

Updated Ratings
NBA Ratings as of 11/29
This iteration includes predicted wins (assuming an average season's worth of home & away opponents).


Recent Twitterings:
-Tyler Zeller's offensive impact. This is based off of the formulas in my prior post, alongside some basic estimates of what a player's teammates produce. The method here does not encapsulate all usable offensive statistics like Dean Oliver's offensive rating, although I have done that in the past. Perhaps I should just stick with that?

-Good News for the 76ers and Bad News for the Magic -- although other stats-head would likely tell you a similar story.

-The Bobcats (I know I said Hornets....gimme a break) are consistent -- and therefore consistently sub-par. The top of a 95% confidence interval maxes out the H...Bobcats at ~41 wins.

Finally - if anyone's interested, I can keep updating NBA league-wide win probabilities (which are probably more accurate than the expected output from my point ratings).

win-probabilities

Statistically, we can try to estimate a team's overall win% against an average team, and say that's their adjusted Win% (similar to Ken Pomeroy's Pythagorean win%). But this is only part of the picture.

Here I have used my consistency and adjusted ratings to predict home and away win probabilities for every NBA matchup. Instead up predicting how a team would fare against an average team, I predict how they fare on average against every team.

Here are the results (the home teams are the rows, the away teams are the columns).

I plug in the following into the NormDist function.

value=Rating(hometeam)-Rating(awayteam)+HomeCourtAdv
mean=0
standard deviation=sqrt(team1consistency^2+team2consistency^2)
(^this estimates overall standard deviation of the two teams' performance, assuming a covariance of zero.)
cumulative?=1

Speaking of which: Some of you may have thought in the past, "This guy doesn't plug stuff into the NormDist function correctly!" And you would be correct. Technically, I should plug in a value of zero and a mean of an estimated point margin. But in order to find that team's win probability, I would do 1-Normdist(0,est. margin). But this requires more typing, so I use the equivalent, Normdist(est. margin,0).

Recency....

I think I need to adjust my ratings for recency! ( http://tinyurl.com/BBstatsNBA )
Here's the sample of the games on Nov. 26th


(Predictions->Games->Updated Predictions)

Predictions (before games) on 11/26:


DENVER>CHICAGO by 3.4
PHOENIX>LA CLIPPERS by 7.7
LA LAKERS>UTAH by .5
MEMPHIS>GOLDEN STATE by 4.1
PORTLAND>NEW ORLEANS by 1.3
ORLANDO>CLEVELAND by 9.8
CHARLOTTE>HOUSTON by 2.8
BOSTON>TORONTO by 8.9
MILWAUKEE>DETROIT by 6.2
MIAMI>PHILADELPHIA by 9.8
INDIANA>OKLAHOMA CITY by 3.3
SAN ANTONIO>DALLAS by 6.3


Actual spreads on 11/26 (*=predicted correctly):

*DENVER>CHICAGO by 1
*PHOENIX>LA CLIPPERS by 8
UTAH>LA LAKERS by 6
*MEMPHIS>GOLDEN STATE by 5
NEW ORLEANS>PORTLAND by 19
*ORLANDO>CLEVELAND by 11
*CHARLOTTE>HOUSTON by 10
*BOSTON>TORONTO by 9
DETROIT>MILWAUKEE by 14
*MIAMI>PHILADELPHIA by 9
OKLAHOMA CITY>INDIANA by 4
DALLAS>SAN ANTONIO by 9

Updated spreads on 11/26 (after inputing actual spreads):
*=retrodictively correct

*DENVER>CHICAGO by 3.1
*PHOENIX>LA CLIPPERS by 7.6
*UTAH>LA LAKERS by .4
GOLDEN STATE>MEMPHIS by 1.6
New Orleans @ Portland = tie
*ORLANDO>CLEVELAND by 9.9
*CHARLOTTE>HOUSTON by 3.6
*BOSTON>TORONTO by 9
*DETROIT>MILWAUKEE by 1.4
*MIAMI>PHILADELPHIA by 9.9
INDIANA>OKLAHOMA CITY by 2.3
SAN ANTONIO>DALLAS by 4.2

My very own ratings!

I have finally done something I've been wanting to do for a long time: make my own ratings system! I have found a source of easily-updated data, and a way to VERY quickly update my ratings!

Here's how it goes, as of games through 11/21.

To do list: adjust for tempo*, adjust for recency.

Adjusting for recency will have to be well-thought out...perhaps finding what weights most accurately predict more recent games/etc.

Tempo -- I'm not sure I'll be able to do this. To add this to my data set will most certainly be a pain, and I'm not quite sure that efficiency margin is a better measure of team quality than point margin -- or vice versa (as I have discussed previously -- relating to NCAA ball).

Turning 4-factors into efficiency (and vice versa) - Part I

I used the definitions of the 4 factors (and other statistics) to derive a formula that gives us Points and Points Per Possession from only the following stats:

-eFG%
-OR%
-TO%
-FTR(%)
-FT%*
-FG%*

I like to just use the 4 factors (as they're found on the game plan page of Ken Pomeroy's team pages) -- we can estimate FT% and FG% depending on how far we are into the season. FT% would be estimated by the team's average FT% (or the league's FT%), and FG% would be estimated by: [the team (or league) ratio of average FG%/average eFG%] x [Game eFG%].

So here's the formula otherwise:


To get points, you simply add FT points and FG points. To get efficiency of course, we add the two and divide by possessions played.

In the upcoming weeks, I'll be using Ken Pomeroy's estimates for efficiency to predict 4-factors according to this method. Later, I'll reverse the process (in hopes to get a better picture at how teams control one another's four factors to get the resultant efficiency).


In case you were wondering: the large bracketed term equals Field Goals Attempted.
In the first formula, we simply multiply FGA by (eFG% x 2), as eFG%=Points per Field Goal Attempted/2.

In the second formula, we simply multiply FTR (FTA/FGA) by the FGA term to cancel the FGAs out to give us FTA.Then FTA are multiplied by FT% to give us total Points from Free Throws.


The large bracketed term was derived like so:

Possessions=FGA-OR+.44*FTA+TO
Poss= FGA-FGA*(1-FG%)*OR%+.44*(FGA*FTR%)
(Poss-TO)=FGA*(1-(1-FG%)*OR%+.44*FTR%)

then divided to give us:

FGA=(Poss-TO)/(.44*FTR%+1-(1-FG%)*OR%)

Redesign!

Blogger has kindly put out some new tools (and a sick new template!) that will hopefully make this blog a little less clunky.


Some current happenings in statistics land:

Check out my Carolina-Duke win probability meter. This will update incrementally as the season goes on, and is based on the probabilities demonstrated by using Ken Pomeroy's predictions, which for the '10-'11 season is only available as of yet by purchasing College Basketball Prospectus '10-'11.

Also, I've got a formula for estimating end-of-season raw efficiencies (where efficiency is points scored per 100 possessions) based on two variables:

1) The number of games a team has played
2) The team's current raw efficiency average (offensive or defensive)


Where g=games played, solve this: x=.141*LN(g)+.466

Where x gives you the weight a team's current average should have compared to the league's average. i.e.
Est. Final Avg= x*Current Avg + (1-x)*League Avg

Have fun and be safe!

The Miami Heat, projected:

Dwayne Wade -
ORTG: 110.3
unadjusted Usg: 33.2%
DRTG: 106.1

Lebron James -
ORTG: 120.1
unadjusted Usg: 32.9%
DRTG: 101.1

Chris Bosh -
ORTG: 112.9
unadjusted Usg: 27%
DRTG: 109.9

Mario Chalmers -
ORTG: 105
unadjusted usg: 17.3%
DRTG: 104

Ilgauskas -
ORTG: 106
unadj. usg: 18.1%
DRTG: 104


Followers

About Me

I wish my heart were as often large as my hands.