
All-Overrated and All-Underrated NBA Teams, 2013
All-Underrated Squad
Nate Robinson, PG
Andre Iguodala, SG
Thaddeus Young, SF
Nick Collison, PF
Kevin Garnett, C
All-Overrated Squad
Deron Williams, PG
JR Smith, SG
Klay Thompson, SF
Earl Clark, PF
Javale McGee, C
BOOM.


Players of the Month: December (so far)
Welcome, all! Here I will be grading players according to their estimated offensive and defensive impacts (using my per-100-possession stat, SimplePlayerRating) via Month-of-December-State. I'm rolling out my Defensive SPR here, finally. Formula at the bottom.
EDIT: Fixed the per-game numbers.
Surprises of the month go to: Andray Blatche (#6 #7), Paul George (#9 #10), Kemba Walker (#10 #11) and JJ Hickson (#17 #21!!!).
Without further ado, here are your top and bottom 26.
The Top 26
The Bottom 26
-The formula for DSPR is
DSPR = (1.3xSteals - 0.1xMissedFG + 0.2xDRB + 0.5xBLK)x100/Possessions Played - 3
-OSPR can be found here.
EDIT: Fixed the per-game numbers.
Surprises of the month go to: Andray Blatche (
Without further ado, here are your top and bottom 26.
The Top 26
| Player | Season | OSPR | DSPR | Total SPR | SPR per Game | |
|---|---|---|---|---|---|---|
| 1 | Carmelo Anthony | 2012-13 | 10.6 | -0.7 | 9.9 | 7.5 |
| 2 | LeBron James | 2012-13 | 6.9 | 1.3 | 8.1 | 6.5 |
| 3 | Blake Griffin | 2012-13 | 7.1 | 2.5 | 9.6 | 6.4 |
| 4 | Kevin Durant | 2012-13 | 6.2 | 0.4 | 6.6 | 5.4 |
| 5 | Chris Paul | 2012-13 | 6.3 | 2.1 | 8.4 | 5.4 |
| 6 | Kobe Bryant | 2012-13 | 6.4 | -0.5 | 5.9 | 5.0 |
| 7 | Andray Blatche | 2012-13 | 4.7 | 3.6 | 8.2 | 4.8 |
| 8 | Ryan Anderson | 2012-13 | 7.9 | -1.4 | 6.5 | 4.6 |
| 9 | Tony Parker | 2012-13 | 7.3 | -0.6 | 6.6 | 4.6 |
| 10 | Paul George | 2012-13 | 4.7 | 1.0 | 5.7 | 4.5 |
| 11 | Kemba Walker | 2012-13 | 6.4 | -0.1 | 6.3 | 4.4 |
| 12 | Chris Copeland | 2012-13 | 12.7 | 1.2 | 13.9 | 4.3 |
| 13 | Russell Westbrook | 2012-13 | 4.9 | 0.8 | 5.8 | 4.2 |
| 15 | Stephen Curry | 2012-13 | 5.0 | -0.3 | 4.7 | 3.9 |
| 16 | Paul Millsap | 2012-13 | 4.1 | 1.3 | 5.4 | 3.7 |
| 17 | James Harden | 2012-13 | 4.0 | 0.5 | 4.5 | 3.7 |
| 18 | Tyson Chandler | 2012-13 | 3.7 | 1.3 | 5.0 | 3.5 |
| 19 | Andrei Kirilenko | 2012-13 | 1.1 | 3.5 | 4.6 | 3.5 |
| 21 | J.J. Hickson | 2012-13 | 5.4 | 1.0 | 6.4 | 3.4 |
| 20 | Matt Barnes | 2012-13 | 4.5 | 1.9 | 6.4 | 3.4 |
| 22 | Ed Davis | 2012-13 | 4.4 | 2.4 | 6.8 | 3.4 |
| 23 | Dwyane Wade | 2012-13 | 5.3 | -0.4 | 4.8 | 3.2 |
| 24 | David Lee | 2012-13 | 3.8 | 0.2 | 4.0 | 3.2 |
| 27 | Kyrie Irving | 2012-13 | 5.9 | -1.6 | 4.3 | 3.2 |
| 26 | Eric Bledsoe | 2012-13 | 3.6 | 4.6 | 8.2 | 3.2 |
The Bottom 26
| Player | Season | OSPR | DSPR | Total SPR | SPR per Game | |
|---|---|---|---|---|---|---|
| 387 | Daniel Gibson | 2012-13 | -5.5 | -1.7 | -7.2 | -3.9 |
| 386 | Kyle Singler | 2012-13 | -4.1 | -1.8 | -5.9 | -3.8 |
| 388 | Doron Lamb | 2012-13 | -8.9 | -1.6 | -10.5 | -3.8 |
| 382 | Mickael Pietrus | 2012-13 | -4.6 | -1.1 | -5.7 | -3.5 |
| 383 | Andre Iguodala | 2012-13 | -5.3 | 0.7 | -4.6 | -3.4 |
| 379 | Chris Singleton | 2012-13 | -5.9 | 0.1 | -5.8 | -3.3 |
| 381 | J.R. Smith | 2012-13 | -3.6 | -1.5 | -5.1 | -3.3 |
| 378 | Andrea Bargnani | 2012-13 | -3.2 | -2.2 | -5.4 | -3.2 |
| 377 | Victor Claver | 2012-13 | -11.3 | 2.0 | -9.3 | -3.2 |
| 376 | Jeff Taylor | 2012-13 | -3.1 | -2.3 | -5.4 | -3.1 |
| 374 | Jerry Stackhouse | 2012-13 | -4.0 | -2.6 | -6.6 | -3.0 |
| 375 | Bismack Biyombo | 2012-13 | -5.0 | 0.5 | -4.5 | -3.0 |
| 372 | Alonzo Gee | 2012-13 | -3.3 | -0.8 | -4.1 | -3.0 |
| 373 | Gerald Green | 2012-13 | -4.7 | -1.9 | -6.7 | -2.9 |
| 370 | Willie Green | 2012-13 | -5.6 | -2.2 | -7.8 | -2.8 |
| 369 | Festus Ezeli | 2012-13 | -7.6 | -0.9 | -8.5 | -2.6 |
| 368 | Dahntay Jones | 2012-13 | -4.1 | -2.4 | -6.5 | -2.6 |
| 367 | Austin Rivers | 2012-13 | -2.6 | -1.7 | -4.3 | -2.6 |
| 365 | Keith Bogans | 2012-13 | -9.1 | -2.6 | -11.7 | -2.6 |
| 364 | Sebastian Telfair | 2012-13 | -3.2 | -2.4 | -5.6 | -2.4 |
| 363 | Aaron Brooks | 2012-13 | -2.7 | -1.6 | -4.3 | -2.4 |
| 361 | Martell Webster | 2012-13 | -2.8 | -1.0 | -3.8 | -2.4 |
| 362 | John Salmons | 2012-13 | -1.8 | -1.8 | -3.6 | -2.4 |
| 359 | Jason Maxiell | 2012-13 | -5.4 | 1.6 | -3.8 | -2.3 |
| 360 | Tony Allen | 2012-13 | -6.1 | 1.5 | -4.6 | -2.3 |
| 358 | Nolan Smith | 2012-13 | -6.5 | -2.8 | -9.3 | -2.3 |
DSPR = (1.3xSteals - 0.1xMissedFG + 0.2xDRB + 0.5xBLK)x100/Possessions Played - 3
-OSPR can be found here.
An Apology for my Quietude: EZ Score
SORRY FOR THE DELAY. I have been hired by the Losangephoenix Spurockets to do basketballysis!
Just kidding.
I've actually been pretty busy doing other church-music related things. Not my bball-twitter-peeps kind of material, I know.
I've had ten or so blog posts in the works, none of which ever reached fruition.
Displeased with my blog production level ( < 20%), I decided to post what I think could probably have made me the most money (I don't know, a couple dollars?) had I decided to streamline and sell it.
Yes, my compassion and eagerness outweighs my entrepreneurial sense. And yes, I did have to spell-check "entrepreneurial."
With sincere apologies to Evan Zamir who owns a 51% market share on the term "EZ" in the basketball-stats world, I present "EZ Score." EZ Score is a game charting system that takes into account every possession (so it requires a bit of rewinding your recorded video), and every player on your team. It is pretty simple to describe, but a little bit open to interpretation. If anyone cares, I can post the Excel-specific nitty gritty on how to accomplish it, but here are the main basic details:
THE RULES OF EZ SCORE:
Now, the weighting. In excel, I weight every possession depending on the # of contributing players
If there is 1 player, they receive 100% of the score & possessions
p1=(100% * points, 1 possession)
If there are 2 players, the first receives 66.67% of the score and possession, the second receives 33.33%.
p1=(66% * points, 0.66 possessions), p2=(33% * points, 0.33 possessions)
If there are 3 players, the first receives 50%, and the second two receive 25% apiece.
p3=(50%*points, 0.5 poss), (25%*points, 0.25 poss)
So, there are many obvious small changes one could make. Many of these would increase the work of the charter and might not necessarily be necessary; it's a balancing act. The most obvious to me is the ability to choose in the two or three-player scenarios between ranked and equal weights for player 2 & 3 (i.e. the ability to say that a scorer-screener-assister are weighted something like 50-30-20 rather than 50-25-25) But I would love to hear your suggestions.
So..here are my results for USA v. France in the Olympics this year. This took maybe 30 minutes more than it would have, had it been a regular game-watching experience.
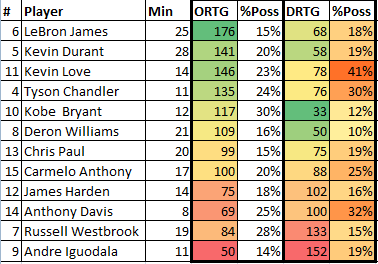
I'll try to do this for a few games this year as my free time permits. Use responsibly!
Just kidding.
I've actually been pretty busy doing other church-music related things. Not my bball-twitter-peeps kind of material, I know.
I've had ten or so blog posts in the works, none of which ever reached fruition.
Displeased with my blog production level ( < 20%), I decided to post what I think could probably have made me the most money (I don't know, a couple dollars?) had I decided to streamline and sell it.
Yes, my compassion and eagerness outweighs my entrepreneurial sense. And yes, I did have to spell-check "entrepreneurial."
With sincere apologies to Evan Zamir who owns a 51% market share on the term "EZ" in the basketball-stats world, I present "EZ Score." EZ Score is a game charting system that takes into account every possession (so it requires a bit of rewinding your recorded video), and every player on your team. It is pretty simple to describe, but a little bit open to interpretation. If anyone cares, I can post the Excel-specific nitty gritty on how to accomplish it, but here are the main basic details:
THE RULES OF EZ SCORE:
Introduction:
This is a system that imitates Dean Oliver's offensive and defensive rating system, although it is a little bit more intensive in that every possession (both offensive and defensive) must be charted. Credit is only given to whomever directly contributes to the possession result. This is pretty wide-open to interpretation, but generally I follow it like so:
Everything past #1 for each data point could be optional if you want, but it will give you less-refined results.
Each possession must be entered manually, simply by entering the player's jersey number like so:
 |
| A dream-team including MJ, Hansbrough, and Penny. |
Where
P1=Most responsible / directly responsible for the possession result
P2=Less responsible than player #1
P3=Less responsible than player #1
i.e.
If only one player truly deserves credit, only enter one player. My excel sheet distributes credit accordingly to the between 1 and 3 players(weights are noted at the end of this section).

THE SPECIFICS:

Offense:
Good possession (2+ points):
P1) Whoever scores
optional:
P2) Pass or screen or offensive rebound leading to score
P3) Pass or screen or offensive rebound leading to #2

Normative plays (1 point):
P1) Whoever scores. Optionally, the assister/etc can receive credit as P2 and/or P3, but this depends on your philosophy (is it the passer's "fault" that the player misses a free throw?, etc)
Bad plays (0 points):
P1) Turnover, missed field goal
optional:
P2) Not boxing out/missing easily available rebound


Defense:
Good possessions (0 points):
P1) Forced field-goal miss or defensive rebound (if more causal than #2), fouls, forced turnovers
optional:
P2) Forced field-goal miss or defensive rebound (if less causal than #1), fouls, forced turnovers, help defense
P3) Same as #2

Normative possessions (1 point):
P1) fouler gets 100% credit

Bad possessions (2+ points):
P1) Your man or your zone scores / fail to switch / etc
P2) If a man is wide open due to #1, whomever helps, etc receives #2.
P3) Same as #2
Now, the weighting. In excel, I weight every possession depending on the # of contributing players
If there is 1 player, they receive 100% of the score & possessions
p1=(100% * points, 1 possession)
If there are 2 players, the first receives 66.67% of the score and possession, the second receives 33.33%.
p1=(66% * points, 0.66 possessions), p2=(33% * points, 0.33 possessions)
If there are 3 players, the first receives 50%, and the second two receive 25% apiece.
p3=(50%*points, 0.5 poss), (25%*points, 0.25 poss)
So, there are many obvious small changes one could make. Many of these would increase the work of the charter and might not necessarily be necessary; it's a balancing act. The most obvious to me is the ability to choose in the two or three-player scenarios between ranked and equal weights for player 2 & 3 (i.e. the ability to say that a scorer-screener-assister are weighted something like 50-30-20 rather than 50-25-25) But I would love to hear your suggestions.
So..here are my results for USA v. France in the Olympics this year. This took maybe 30 minutes more than it would have, had it been a regular game-watching experience.
I'll try to do this for a few games this year as my free time permits. Use responsibly!
Introducing SPR (Offense)
If you're like me, and you run regressions of statistics against multi-year regularized-adjusted plus-minus in your spare time, you'll note that there are numerous ways to come up with good estimates. Wanting to create a system that requires as little math as possible, I have found combinations that can estimate offensive value well, while not requiring people to utilize long strings of decimals.
So I've decided to finally release my Simple Player Rating (for offense) to the public. Here it go!
"SPR: Offense" represents an estimate of how much a player boosted their team's offensive rating above average.
SPR: Offense =
(Points - FGmade - Turnovers + 0.5 x (Oreb + Assists - FGmissed - Free Throw Attempts))*100/Possessions Played - 6.5
a)To come up with possessions played, you can find this on any basketball-reference.com box score:
Possessions Played = Pace x (Minutes Played) / (Game Minutes, Usually 48)
b) Also, if you want to convert this to a per-game statistic, simply multiply by:
(Minutes Played) / (Game Minutes)
Here is how this stat correlates with 8-year-RAPM:

In case you were wondering, with the raw values that my regression gave me the R^2 is only 0.01 higher.
And here are the per-game and per-100 SPR Offense from Miami vs Boston Game 6, aka "BRON-BRON GOES NUTS."

Defense is coming soon. Enjoy responsibly!
So I've decided to finally release my Simple Player Rating (for offense) to the public. Here it go!
"SPR: Offense" represents an estimate of how much a player boosted their team's offensive rating above average.
SPR: Offense =
(Points - FGmade - Turnovers + 0.5 x (Oreb + Assists - FGmissed - Free Throw Attempts))*100/Possessions Played - 6.5
a)To come up with possessions played, you can find this on any basketball-reference.com box score:
Possessions Played = Pace x (Minutes Played) / (Game Minutes, Usually 48)
b) Also, if you want to convert this to a per-game statistic, simply multiply by:
(Minutes Played) / (Game Minutes)
Here is how this stat correlates with 8-year-RAPM:
In case you were wondering, with the raw values that my regression gave me the R^2 is only 0.01 higher.
And here are the per-game and per-100 SPR Offense from Miami vs Boston Game 6, aka "BRON-BRON GOES NUTS."
Defense is coming soon. Enjoy responsibly!
New Stat: SLEASY%
SLEASY% (Super-Lazy-Estimate-of-Assisted-Shots,Yo%)
Based on Dean Oliver's realization that a player's % of shots assisted on is extremely close to:
=1.14*(Team Assists - Player Assists)/(Team Field Goals Made)
I plugged this into a large NBA player dataset, where:
Team Assists per 100 = 5*Average(Assists per 100)
Team Field Goals Made per 100= 4*Average(Field-Goals-Made-Per-100)+playerFGMper100
The logic is a little hazy, especially considering that the "team" assists are made up of 5 average players, but we are subtracting a non-average player. So it's lazy.
OK, from here, we can get a linear regression. The correlation is EXTREMELY high, but definitely misses the mark on a few players with very high field-goals made or assists dished per 100:
SLEASY% = 0.73 - 0.03xAssistsPer100 - 0.01xFieldGoalsMadePer100
In my 8-year dataset for the NBA through 2011, we find the following top and bottom 10:

Pretty straightforward...low usage players up-top, frequent shooting PGs at the bottom. Can't assist yourself! Or can you ??
Based on Dean Oliver's realization that a player's % of shots assisted on is extremely close to:
=1.14*(Team Assists - Player Assists)/(Team Field Goals Made)
I plugged this into a large NBA player dataset, where:
Team Assists per 100 = 5*Average(Assists per 100)
Team Field Goals Made per 100= 4*Average(Field-Goals-Made-Per-100)+playerFGMper100
The logic is a little hazy, especially considering that the "team" assists are made up of 5 average players, but we are subtracting a non-average player. So it's lazy.
OK, from here, we can get a linear regression. The correlation is EXTREMELY high, but definitely misses the mark on a few players with very high field-goals made or assists dished per 100:
SLEASY% = 0.73 - 0.03xAssistsPer100 - 0.01xFieldGoalsMadePer100
In my 8-year dataset for the NBA through 2011, we find the following top and bottom 10:
Pretty straightforward...low usage players up-top, frequent shooting PGs at the bottom. Can't assist yourself! Or can you ??
Condensed Tweets
Sweeter than condensed milk.
Jibber-Jabber:
I don't hate Calipari a lot this year...
Hoos
Your Simple March Madness Playlist
Numbers:
MLSUOTFR
TSHT9TWGF
Low-Seeded Teams With Depth
High-Seeded Teams With...Shallowness
Cuse isn't much of a one-seed (Although this isn't because of Melo)
Parity!
Four-Factors goes 3 and 0.
Final Cheat Sheet (Updated)
Memphis v St Louis is unfortunate, I agree
Over and out.
Jibber-Jabber:
I don't hate Calipari a lot this year...
Hoos
Your Simple March Madness Playlist
Numbers:
MLSUOTFR
TSHT9TWGF
Low-Seeded Teams With Depth
High-Seeded Teams With...Shallowness
Cuse isn't much of a one-seed (Although this isn't because of Melo)
Parity!
Four-Factors goes 3 and 0.
Final Cheat Sheet (Updated)
Memphis v St Louis is unfortunate, I agree
Over and out.
2012 Bracket Cheat Sheet
Why yes, it is the most wonderful time of the year.
I've simulated the NCAA tournament 10,000 times with the following specifications
-Brigham Young out. Iona is out. I mistyped.
-Miss. Valley State out.
-Injured/disqualified players out.
-Minutes adjusted (better players getting more and vice versa).
-Home-court advantage adjusted for.
-Lucky efficiency accounted for (somewhat)..i.e. TO% and Defensive Rebound% are worth more than "usual," for example.
Using all of this, I created a bracket cheat sheet. Guaranteed to beat Pomeroy, Sagarin, and the LRMC!*
http://dl.dropbox.com/u/241759/TournamentCheatSheet.xlsx
Enjoy, and use responsibly. Don't gamble with this stuff.
*-OK, not really guaranteed.
I've simulated the NCAA tournament 10,000 times with the following specifications
-
-Miss. Valley State out.
-Injured/disqualified players out.
-Minutes adjusted (better players getting more and vice versa).
-Home-court advantage adjusted for.
-Lucky efficiency accounted for (somewhat)..i.e. TO% and Defensive Rebound% are worth more than "usual," for example.
Using all of this, I created a bracket cheat sheet. Guaranteed to beat Pomeroy, Sagarin, and the LRMC!*
http://dl.dropbox.com/u/241759/TournamentCheatSheet.xlsx
Enjoy, and use responsibly. Don't gamble with this stuff.
*-OK, not really guaranteed.
The Orange Are Okay.
Before we begin: credit to the numbers here go out to Daniel Myers @DSMok1 and his NCAA statistical plus-minus sheet. I have my own version (which I made about a day before his :), but it didnt' respond to Sports-Reference's reformatting very well.
If we assume that Melo's minutes get replaced by Christmas, and also slightly replaced by James Southerland, we see the following:
Efficiency Margin per 100 (with Melo having high Minutes%): 31.7
Efficiency Margin per 100 (with Melo's minutes replaced by Christmas, then Southerland): 30.4
This is a difference of -1.3 points per 100 possessions, or just -0.82 points per game, in total point margin. So Syracuse moves from a (rough statistical estimate:) #6 team to a #9 team.
Why does this happen?
I will show you.
I am just making some guesses here, but:
-Melo was playing 58% of Cuse's minutes beforehand...he missed a few games. So I bump this up to 74% to compensate/guesstimate.
-Also to compensate, I bump underrated James Southerland's minutes down by 0.1%, and Christmas' minutes down by 16%.
So we then get the following:

Orange are okay! Just probably underrated by impressionable bracketeers.
If we assume that Melo's minutes get replaced by Christmas, and also slightly replaced by James Southerland, we see the following:
Efficiency Margin per 100 (with Melo having high Minutes%): 31.7
Efficiency Margin per 100 (with Melo's minutes replaced by Christmas, then Southerland): 30.4
This is a difference of -1.3 points per 100 possessions, or just -0.82 points per game, in total point margin. So Syracuse moves from a (rough statistical estimate:) #6 team to a #9 team.
Why does this happen?
I will show you.
I am just making some guesses here, but:
-Melo was playing 58% of Cuse's minutes beforehand...he missed a few games. So I bump this up to 74% to compensate/guesstimate.
-Also to compensate, I bump underrated James Southerland's minutes down by 0.1%, and Christmas' minutes down by 16%.
So we then get the following:
Orange are okay! Just probably underrated by impressionable bracketeers.
The True Value of the Four Factors
Dean Oliver's four-factors are well-understood in how they impact the game.
To figure this out, people usually run a regression of game or team four-factors versus efficiency.
We find the following, roughly:
We find the following, roughly:
| raw coefficients | |
|---|---|
| OeFG% | 1.32 |
| OTO% | -1.19 |
| OOR% | 0.63 |
| OFTM/FGA | 0.17 |
| DeFG% | -1.32 |
| DTO% | 1.19 |
| DOR% | -0.63 |
| DFTR | -0.11 |
However, to say that these are the proper weights for each of these is to assume that each of these is just as controlled by the offense as the defense. Ken Pomeroy has been blogging on the subject and it got me thinking: there is no way that these can be the true (relative) PREDICTIVE values for four-factors.
I ran a LOOCV test for each 2010-11 NCAA team, for each game they played (for both teams).
In layman's terms: I looked at each game, then averaged all the four factors for the other games a team played.
The results look may only slightly different. The difference is, in fact, huge.
| predictive coef | |
|---|---|
| OeFG% | 1.27 |
| OTO% | -1.71 |
| OOR% | 0.73 |
| OFTM/FGA | 0.17 |
| DeFG% | -1.11 |
| DTO% | 0.99 |
| DOR% | -0.62 |
| DFTR | -0.19 |
The differences can be outlined here (x = predictive / raw) :
| x | |
|---|---|
| OeFG% | 96% |
| OTO% | 144% |
| OOR% | 116% |
| OFTM/FGA | 103% |
| DeFG% | 84% |
| DTO% | 83% |
| DOR% | 99% |
| DFTR | 174% |
This is now the basis for my ratings. The strength of schedule part is a bit of a guess, but the results are so different no matter what I do, I can't really tell if it's working :)
All this to say: Murray State is actually more overrated than we thought (#227 in offensive TO%, somehow).
Conference Bias in the Polls: No Mountain-West Love
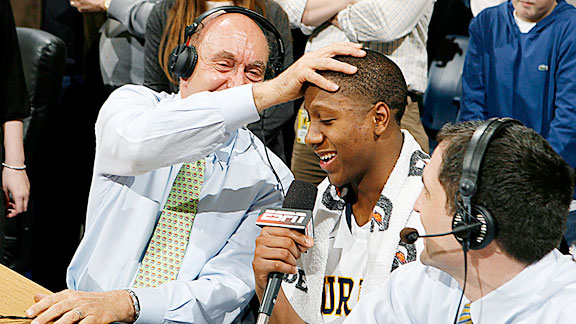 |
| "The Nation's Best Point Guard" apparently. |
 I did a very quick study on how conferences/teams are underrated or overrated in the polls.
First, I combined the ESPN and AP Polls from Monday.
Here's a simple formula based on regression to add the vote totals from both polls for NCAA basketball:
Total Adjusted Votes= AP votes + (2*ESPN Votes+26)
The top-27 in this method is shown left.
All teams worse than #27 were given a simple "#40" as a placeholder . I then compared each of these team's rankings to my own ranking system, which is very similar to Ken Pomeroy's...I can just fiddle with it as I please :). From this, it's pretty easy to see that teams that have won a lot of close games are overrated and vice versa (if you trust us stat-geeks on the principle of 'luck').
To convert Luck (Win% - Expected Win%) to ranking deviation (Poll rank - my rank), I found the following easy equation:
Expected Ranking Deviation = 140 * Luck% - 0.38
So for each conference, I found the average luck of my top 49 (I stopped at 49 because that's where Murray is ranked) and found the following. I split the rankings into three categories
-Murray State (the only OVC team here, and the most overrated team in the country)
-Conferences (with at least 2 listed teams in the poll)
-Other Conferences (the total of each of the conferences with one bid)
Like so:
| # | Top 40 Avg Luck | |
|---|---|---|
| Murray State | 1 | 0.138 |
| A10 | 2 | 0.016 |
| WCC | 3 | 0.009 |
| MVC | 2 | 0.004 |
| Other Mid-Majors | 5 | -0.002 |
| BE | 9 | -0.002 |
| MWC | 2 | -0.007 |
| B12 | 6 | -0.012 |
| ACC | 5 | -0.014 |
| P12 | 2 | -0.033 |
| B10 | 6 | -0.040 |
| SEC | 4 | -0.048 |
Then I used the Expected Ranking Deviation formula to come up with each 'conference's average expected ranking deviation:
| # | ExpRkDiff | |
|---|---|---|
| Murray State | 1 | 18.9 |
| A10 | 2 | 1.9 |
| WCC | 3 | 0.9 |
| MVC | 2 | 0.1 |
| Other Mid-Majors | 5 | -0.7 |
| BE | 9 | -0.7 |
| MWC | 2 | -1.4 |
| B12 | 6 | -2.0 |
| ACC | 5 | -2.4 |
| P12 | 2 | -5.0 |
| B10 | 6 | -6.0 |
| SEC | 4 | -7.1 |
Then I simply subtracted each team's Expected Ranking Difference from their Actual Ranking Difference to give us an estimate of conference bias. The results are pretty intuitive:
| # | Top 40 Luck | ExpRkDiff | ActualRkDiff | Bias | |
|---|---|---|---|---|---|
| Murray State | 1 | 0.138 | 18.9 | 33.0 | 14.1 |
| B10 | 6 | -0.040 | -6.0 | -2.0 | 4.0 |
| BE | 9 | -0.002 | -0.7 | 3.0 | 3.7 |
| ACC | 5 | -0.014 | -2.4 | 1.2 | 3.6 |
| SEC | 4 | -0.048 | -7.1 | -7.0 | 0.1 |
| WCC | 3 | 0.009 | 0.9 | -0.7 | -1.6 |
| MVC | 2 | 0.004 | 0.1 | -1.5 | -1.6 |
| B12 | 6 | -0.012 | -2.0 | -4.3 | -2.3 |
| P12 | 2 | -0.033 | -5.0 | -8.0 | -3.0 |
| Other Mid-Majors | 5 | -0.002 | -0.7 | -5.4 | -4.7 |
| A10 | 2 | 0.016 | 1.9 | -6.5 | -8.4 |
| MWC | 2 | -0.007 | -1.4 | -12.0 | -10.6 |
The only real surprise to my eyes is the Big 12 having a bias of -2.3. Murray State is overrated by their ridiculously easy schedule which they haven't beaten to a pulp. The only four other overrateds are the rest of the power conferences minus the Pac-12, who is still in "recovery mode."

How To Adjust Game Results for Garbage Time (NCAA)
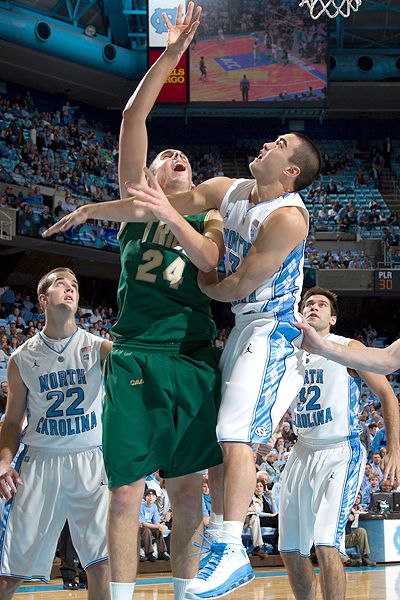 |
| UNC's Blue Steel scrubs. Photo 100% stolen from ESPN.com |
a) the scrubs begin playing
b) teams try and make a comeback despite a mighty deficit...tons of free throw shooting that could skew the point margin in either team's favor
c) the winning team doesn't care about playing anymore, really...
d) etc
Bill James (of baseball stats fame) introduced his own simple metric that StatSheet.com uses, and succeeds rather invariably: Lead "Safeness." Bill James also refers to Coach K as "the human typo" in that article. I love him.
Anyways, the math is pretty straightforward (I remove the bit about who has the ball to make it easier to calculate, as it averages to zero):
(Point Margin - 3)^2 / Seconds Remaining = % Safe
So we do a little algebra, and we can quickly estimate point margin when the lead became 100% safe:
Point Margin =Sqrt(seconds remaining when safe) + 3
Which we then use to forecast the rest of the game, ignoring how it actually played out:
Adjusted Final Margin = [sqrt(Seconds Remaining when safe)+3] x 40 / [40-(Seconds Remaining when safe/60)]
You can easily find "seconds remaining when safe" via StatSheet.com. For example, last night's UNC-Wake Forest Game was "statistically over" with 3:48 left to go. Plus this in to my handy-dandy spreadsheet, and you get:
Point Margin When Safe: ~18
Adjusted Final Point Margin: 20
So while the Heels only won by 15, they had plenty of room to let the game slide in the final minutes - if they had played with the same quality all the way through they would have won by around 20.
NCAA Teams' Bench Impact
Bench Impact = estimated total Bench Rating per 100 possessions x %Minutes - estimated Starters' Rating per 100 possessions x %Minutes
-Wyoming/Colorado's bench impact is low because of true disparity between their starting 5 and their bench.
-Ohio State's bench is actually decent, but their starting 5 is significantly better....
-Grambling suffers immensely by not playing Quincy Roberts more -- EDIT -- this was because of the transfer rules that prevented Q-Rob from playing the first half of the season, so technically he was on their "bench" when I ranked his minutes played back in January. His presence was definitely the most notable discrepancy in minutes played and overall value because of that.
Bottom 25
Top 25
-Wyoming/Colorado's bench impact is low because of true disparity between their starting 5 and their bench.
-Ohio State's bench is actually decent, but their starting 5 is significantly better....
-Grambling suffers immensely by not playing Quincy Roberts more -- EDIT -- this was because of the transfer rules that prevented Q-Rob from playing the first half of the season, so technically he was on their "bench" when I ranked his minutes played back in January. His presence was definitely the most notable discrepancy in minutes played and overall value because of that.
Bottom 25
| team | bench impact | |
|---|---|---|
| 1 | Wyoming | -10.35 |
| 2 | South Carolina Upstate | -10.31 |
| 3 | Colorado | -9.36 |
| 4 | Green Bay | -9.14 |
| 5 | Alabama State | -9.08 |
| 6 | Florida International | -9.01 |
| 7 | Ohio State | -8.96 |
| 8 | Northern Iowa | -8.90 |
| 9 | Maryland | -8.78 |
| 10 | Evansville | -8.75 |
| 11 | Cal Poly | -8.62 |
| 12 | Monmouth | -8.61 |
| 13 | Texas State | -8.56 |
| 14 | Tennessee State | -8.18 |
| 15 | South Carolina | -7.94 |
| 16 | Lehigh | -7.87 |
| 17 | Lamar | -7.85 |
| 18 | Jackson State | -7.84 |
| 19 | Southeast Missouri State | -7.78 |
| 20 | Rider | -7.76 |
| 21 | Tennessee-Martin | -7.74 |
| 22 | Xavier | -7.67 |
| 23 | Pepperdine | -7.63 |
| 24 | St. Francis (NY) | -7.57 |
| 25 | Utah | -7.35 |
Top 25
| team | bench impact | |
|---|---|---|
| 1 | Grambling | 5.87 |
| 2 | South Alabama | 2.79 |
| 3 | Vermont | 2.54 |
| 4 | Colorado State | 2.50 |
| 5 | Loyola Marymount | 2.46 |
| 6 | North Carolina-Greensboro | 1.75 |
| 7 | Texas Southern | 1.53 |
| 8 | Oklahoma State | 1.39 |
| 9 | Western Carolina | 1.03 |
| 10 | William & Mary | 1.00 |
| 11 | Cornell | 0.97 |
| 12 | Marist | 0.94 |
| 13 | California-Santa Barbara | 0.85 |
| 14 | Maryland-Eastern Shore | 0.68 |
| 15 | Western Michigan | 0.51 |
| 16 | IPFW | 0.49 |
| 17 | Southern Mississippi | 0.41 |
| 18 | Alcorn State | 0.35 |
| 19 | Southeastern Louisiana | 0.35 |
| 20 | Southern Methodist | 0.28 |
| 21 | Canisius | 0.26 |
| 22 | Rhode Island | 0.26 |
| 23 | Miami (FL) | 0.24 |
| 24 | Toledo | 0.15 |
| 25 | East Tennessee State | 0.13 |
Top 25 Players as of 1/18/2011
I have adjusted minutes% for teammate quality and injuries (I factor back in minutes played above or below what we would expect a coach to play them with a number I call SQZ: how much more or less a coach squeezes out of a player over the course of a game.)
True Impact per Game = Efficiency Impact x (expected min% while healthy, with average teammates)
True Impact per Game = Efficiency Impact x (expected min% while healthy, with average teammates)
| rank | player | team | ORTG | usage% | DRTG | True Impact per Game |
|---|---|---|---|---|---|---|
| 1 | Kevin Jones | West Virginia | 129.6 | 24.2 | 92.5 | 9.6 |
| 2 | Jared Sullinger | Ohio State | 128.9 | 26.3 | 76 | 9.4 |
| 3 | Damian Lillard | Weber State | 136.1 | 32.2 | 99.2 | 9.4 |
| 4 | Marcus Denmon | Missouri | 140.5 | 23.2 | 93.9 | 8.6 |
| 5 | Thomas Robinson | Kansas | 117.3 | 28.2 | 78.7 | 8.5 |
| 6 | Anthony Davis | Kentucky | 140.5 | 18 | 73.6 | 8.1 |
| 7 | Doug McDermott | Creighton | 127.7 | 31.6 | 102 | 7.9 |
| 8 | Kenny Boynton | Florida | 135.9 | 24.6 | 102.8 | 7.6 |
| 9 | Dominique Morrison | Oral Roberts | 131 | 25.4 | 103.1 | 7.4 |
| 10 | Will Barton | Memphis | 119 | 26 | 94.4 | 7.3 |
| 11 | Cody Zeller | Indiana | 134 | 22.2 | 90 | 7.2 |
| 12 | J'Covan Brown | Texas | 122.6 | 28.2 | 100.7 | 7.1 |
| 13 | John Shurna | Northwestern | 117.5 | 27.4 | 102.4 | 7.0 |
| 14 | Mike Scott | Virginia | 127.1 | 28.7 | 82.3 | 6.9 |
| 15 | Jae Crowder | Marquette | 124.6 | 23.3 | 84.6 | 6.7 |
| 16 | Isaiah Canaan | Murray State | 130.3 | 26.4 | 95.8 | 6.6 |
| 17 | Deshaun Thomas | Ohio State | 124.8 | 23.8 | 89.7 | 6.6 |
| 18 | Hollis Thompson | Georgetown | 129 | 21.3 | 93 | 6.6 |
| 19 | John Jenkins | Vanderbilt | 127.1 | 26.3 | 101 | 6.6 |
| 20 | Nate Wolters | South Dakota State | 121.2 | 30 | 101.9 | 6.4 |
| 21 | Ricardo Ratliffe | Missouri | 138.2 | 22.4 | 91.5 | 6.3 |
| 22 | Jeremy Lamb | Connecticut | 120.9 | 23.6 | 100 | 6.2 |
| 23 | Drew Crawford | Northwestern | 119.1 | 25.5 | 104.7 | 6.2 |
| 24 | Jordan Taylor | Wisconsin | 115.8 | 24.5 | 86.7 | 6.2 |
| 25 | Jason Clark | Georgetown | 117.5 | 26.1 | 89.8 | 6.0 |
Top 25 Freshies, as of 1/11/2012
EDIT: Misleading title. This only includes games through 1/11, not 1/13.
By team impact (estimated efficiency margin impact times % of possessions played).
By team impact (estimated efficiency margin impact times % of possessions played).
| rank | player | team | conf | ORTG | usage% | DRTG | Eff Imp. | Team Imp. |
|---|---|---|---|---|---|---|---|---|
| 1 | Anthony Davis | Kentucky | SEC | 134 | 18 | 71 | 9.37 | 6.79 |
| 2 | Cody Zeller | Indiana | Big Ten | 134 | 22 | 86 | 9.63 | 6.50 |
| 3 | Kevin Pangos | Gonzaga | WCC | 132 | 21 | 97 | 7.75 | 5.88 |
| 4 | Michael Kidd-Gilchrist | Kentucky | SEC | 120 | 21 | 85 | 5.96 | 4.60 |
| 5 | Sheldon McClellan | Texas | Big 12 | 132 | 21 | 96 | 7.17 | 4.58 |
| 6 | Spencer DinWiddie | Colorado | Pac-12 | 127 | 21 | 96 | 5.96 | 3.76 |
| 7 | Trey Burke | Michigan | Big Ten | 110 | 25 | 97 | 4.30 | 3.67 |
| 8 | D'Angelo Harrison | St. John's (NY) | Big East | 116 | 24 | 102 | 3.81 | 3.32 |
| 9 | Austin Rivers | Duke | ACC | 108 | 26 | 103 | 4.47 | 3.32 |
| 10 | Seth Tuttle | Northern Iowa | MVC | 123 | 19 | 89 | 6.14 | 3.23 |
| 11 | Kentavious Caldwell-Pope | Georgia | SEC | 109 | 27 | 99 | 4.15 | 3.18 |
| 12 | Adam Smith | North Carolina-Wilmington | CAA | 116 | 27 | 111 | 4.08 | 3.09 |
| 13 | Jonathan Holmes | Texas | Big 12 | 126 | 19 | 94 | 5.53 | 3.06 |
| 14 | Anthony Drmic | Boise State | MWC | 123 | 24 | 98 | 4.66 | 3.06 |
| 15 | Omari Grier | Florida Atlantic | Sun Belt | 130 | 21 | 105 | 6.58 | 3.04 |
| 16 | Justin Edwards | Maine | AEC | 120 | 26 | 99 | 3.97 | 3.01 |
| 17 | Otto Porter | Georgetown | Big East | 116 | 16 | 88 | 4.19 | 2.85 |
| 18 | Jordan Tolbert | Texas Tech | Big 12 | 113 | 31 | 96 | 4.68 | 2.76 |
| 19 | Rodney Hood | Mississippi State | SEC | 125 | 17 | 100 | 3.19 | 2.69 |
| 20 | Andre Drummond | Connecticut | Big East | 112 | 20 | 94 | 3.83 | 2.59 |
| 21 | B.J. Young | Arkansas | SEC | 117 | 27 | 94 | 4.32 | 2.56 |
| 22 | P.J. Hairston | North Carolina | ACC | 124 | 26 | 93 | 7.68 | 2.50 |
| 23 | Quinn Cook | Duke | ACC | 137 | 20 | 102 | 7.87 | 2.48 |
| 24 | Quincy Miller | Baylor | Big 12 | 109 | 25 | 88 | 4.02 | 2.34 |
| 25 | Michael Caffey | Long Beach State | Big West | 120 | 15 | 98 | 4.34 | 2.33 |
Top 51 Overall NCAA Players as of 1/10
Games through 1/10.
Team Impact = (Estimated Efficiency Impact per 100 possessions) x (% of Possessions played in)
Where offensive and defensive efficiency impacts are estimated* by using offensive and defensive rating (& offensive usage%) at sports-reference.com, and strength of schedule from kenpom.com.
So, Lillard is the primary reason that an otherwise-extremely-mediocre offensive team (Pomeroy subscribers only) is #57th in the Pomeroys for offense. Weber's second-best offensive player (Scott Bamforth) uses 10% usage less, and is 10 points per 100 less efficient.
When I sum up all of Weber State's offensive contributions, we get +14.4. Their adjusted offensive rating is only +8 or so on kenpom.com, so it's my guess that (but if we just fit players' performances to their team ratings, we get some extremely ugly results, so I don't do that...I am basing it on last year's fit for Strength of Schedule, however). Even if we multiply each player's offensive value by 0.6 (which is roughly the same as 8/14.4), Lillard is still a top-25 player.
Mike Scott is still also an extremely good player as far as the eye can see, and is even underrated by his minutes (like Sullinger).
* Not going to reveal the regression equation just yet. Or ever :-)
Team Impact = (Estimated Efficiency Impact per 100 possessions) x (% of Possessions played in)
Where offensive and defensive efficiency impacts are estimated* by using offensive and defensive rating (& offensive usage%) at sports-reference.com, and strength of schedule from kenpom.com.
| rank | player | team | conf | Offensive Impact (100) | Defensive Impact (100) | Total Impact (100) | Team Impact | Min% |
| 1 | Damian Lillard | Weber State | Big Sky | 13.5 | -0.4 | 13.1 | 11.0 | 84% |
| 2 | Kevin Jones | West Virginia | Big East | 7.9 | 2.2 | 10.1 | 9.1 | 90% |
| 3 | Doug McDermott | Creighton | MVC | 11.1 | -0.6 | 10.5 | 8.1 | 77% |
| 4 | Dominique Morrison | Oral Roberts | Summit | 9.0 | -0.1 | 8.9 | 7.9 | 89% |
| 5 | Jared Sullinger | Ohio State | Big Ten | 8.0 | 4.8 | 12.8 | 7.8 | 61% |
| 6 | Marcus Denmon | Missouri | Big 12 | 9.1 | 0.7 | 9.8 | 7.8 | 80% |
| 7 | Isaiah Canaan | Murray State | OVC | 8.9 | 0.6 | 9.5 | 7.5 | 79% |
| 8 | Will Barton | Memphis | CUSA | 6.7 | 1.7 | 8.4 | 7.3 | 87% |
| 9 | Thomas Robinson | Kansas | Big 12 | 4.8 | 4.5 | 9.3 | 7.2 | 77% |
| 10 | Kenny Boynton | Florida | SEC | 10.0 | -0.8 | 9.2 | 7.2 | 78% |
| 11 | Mike Scott | Virginia | ACC | 7.5 | 2.1 | 9.6 | 7.0 | 73% |
| 12 | Jae Crowder | Marquette | Big East | 6.7 | 2.6 | 9.3 | 7.0 | 75% |
| 13 | Anthony Davis | Kentucky | SEC | 4.2 | 5.2 | 9.4 | 6.8 | 73% |
| 14 | Cody Zeller | Indiana | Big Ten | 7.1 | 2.5 | 9.6 | 6.5 | 68% |
| 15 | Nate Wolters | South Dakota State | Summit | 8.2 | -0.6 | 7.6 | 6.4 | 85% |
| 16 | Jeremy Lamb | Connecticut | Big East | 6.1 | 0.9 | 7.0 | 6.3 | 90% |
| 17 | Noah Hartsock | Brigham Young | WCC | 5.5 | 2.4 | 7.9 | 6.3 | 79% |
| 18 | Colt Ryan | Evansville | MVC | 6.8 | 0.1 | 6.9 | 6.2 | 90% |
| 19 | Jarrod Jones | Ball State | MAC | 6.8 | 1.2 | 7.9 | 6.2 | 78% |
| 20 | Larry Anderson | Long Beach State | Big West | 5.0 | 2.0 | 7.1 | 6.2 | 87% |
| 21 | John Jenkins | Vanderbilt | SEC | 7.7 | 0.4 | 8.1 | 6.2 | 76% |
| 22 | Doron Lamb | Kentucky | SEC | 7.0 | 1.1 | 8.1 | 6.1 | 76% |
| 23 | Ryan Broekhoff | Valparaiso | Horizon | 7.0 | 0.6 | 7.6 | 6.1 | 80% |
| 24 | Ryan Kelly | Duke | ACC | 7.8 | 1.9 | 9.6 | 6.0 | 62% |
| 25 | Hollis Thompson | Georgetown | Big East | 6.4 | 1.5 | 7.9 | 5.9 | 76% |
| 26 | Deshaun Thomas | Ohio State | Big Ten | 6.0 | 2.4 | 8.4 | 5.9 | 70% |
| 27 | Kevin Pangos | Gonzaga | WCC | 6.7 | 1.0 | 7.7 | 5.9 | 76% |
| 28 | Drew Crawford | Northwestern | Big Ten | 6.9 | -0.1 | 6.8 | 5.7 | 85% |
| 29 | Steven Pledger | Oklahoma | Big 12 | 7.4 | 0.3 | 7.7 | 5.6 | 74% |
| 30 | Kris Joseph | Syracuse | Big East | 5.6 | 1.9 | 7.5 | 5.6 | 74% |
| 31 | C.J. McCollum | Lehigh | Patriot | 6.9 | 0.3 | 7.2 | 5.6 | 77% |
| 32 | Jordan Theodore | Seton Hall | Big East | 4.7 | 1.5 | 6.2 | 5.5 | 90% |
| 33 | Brian Conklin | Saint Louis | A-10 | 6.3 | 1.4 | 7.7 | 5.5 | 71% |
| 34 | J'Covan Brown | Texas | Big 12 | 5.9 | 0.8 | 6.7 | 5.5 | 82% |
| 35 | Reggie Hamilton | Oakland | Summit | 7.8 | -1.2 | 6.6 | 5.5 | 84% |
| 36 | Chase Tapley | San Diego State | MWC | 5.3 | 1.6 | 6.9 | 5.5 | 80% |
| 37 | Langston Galloway | Saint Joseph's | A-10 | 5.6 | 0.8 | 6.4 | 5.5 | 85% |
| 38 | Allen Crabbe | California | Pac-12 | 5.4 | 1.2 | 6.6 | 5.4 | 82% |
| 39 | John Shurna | Northwestern | Big Ten | 6.0 | 0.1 | 6.1 | 5.4 | 88% |
| 40 | Deonte Burton | Nevada | WAC | 6.5 | 0.5 | 7.0 | 5.4 | 77% |
| 41 | Zack Rosen | Pennsylvania | Ivy | 6.1 | -0.3 | 5.7 | 5.4 | 94% |
| 42 | Erick Green | Virginia Tech | ACC | 6.2 | 0.7 | 6.9 | 5.3 | 77% |
| 43 | Julian Mavunga | Miami (OH) | MAC | 4.7 | 1.0 | 5.6 | 5.3 | 94% |
| 44 | Draymond Green | Michigan State | Big Ten | 3.2 | 3.4 | 6.6 | 5.3 | 80% |
| 45 | Chace Stanback | Nevada-Las Vegas | MWC | 6.5 | 1.5 | 8.0 | 5.3 | 66% |
| 46 | Anthony Raffa | Coastal Carolina | Big South | 4.7 | 1.8 | 6.5 | 5.2 | 80% |
| 47 | Robbie Hummel | Purdue | Big Ten | 5.4 | 1.4 | 6.8 | 5.1 | 76% |
| 48 | Trevor Releford | Alabama | SEC | 4.5 | 2.5 | 7.0 | 5.1 | 73% |
| 49 | Ricardo Ratliffe | Missouri | Big 12 | 7.3 | 1.4 | 8.7 | 5.1 | 59% |
| 50 | Robert Covington | Tennessee State | OVC | 6.8 | 0.2 | 7.0 | 5.1 | 73% |
| 51 | Tyler Zeller | North Carolina | ACC | 4.9 | 3.0 | 7.8 | 5.1 | 65% |
So, Lillard is the primary reason that an otherwise-extremely-mediocre offensive team (Pomeroy subscribers only) is #57th in the Pomeroys for offense. Weber's second-best offensive player (Scott Bamforth) uses 10% usage less, and is 10 points per 100 less efficient.
When I sum up all of Weber State's offensive contributions, we get +14.4. Their adjusted offensive rating is only +8 or so on kenpom.com, so it's my guess that (but if we just fit players' performances to their team ratings, we get some extremely ugly results, so I don't do that...I am basing it on last year's fit for Strength of Schedule, however). Even if we multiply each player's offensive value by 0.6 (which is roughly the same as 8/14.4), Lillard is still a top-25 player.
Mike Scott is still also an extremely good player as far as the eye can see, and is even underrated by his minutes (like Sullinger).
* Not going to reveal the regression equation just yet. Or ever :-)
No Apologies, Just Numbers
Okay, some apologies.
My prior post has sparked a little bit of interest/intrigue/outrage/fear among college basketball fans.
Never fear! Happier numbers are on the way.
First, let me reiterate that these are based on advanced stats only, such as offensive rating and defensive rating, from Sports-Reference.com. There are no plus-minus stats involved.
I realized that there were some pretty important adjustments that needed to be made. First, that players with extremely high numbers in any one category were being skewed.* Second, that the strength of schedule adjustment was a little counter-intuitive, and a little too strong. I adjusted my ratings thusly.
Unfortunately, the sample size for this season does not produce very intuitive results at the moment, which I should have mentioned in my last post (so please don't destroy me for anything that looks strange...just chew on it). For example, that Weber State's Damian Lillard is number one in the system. While I am a huge fan of Lillard and would have no problem listing him up there at the end of the year if things remain the same, I am wary of the fact that his team impact is two full points higher than the next-highest (and his per-possession impact is higher than Sullinger's). As major-conference teams improve their strength of schedules during conference play and players get more minutes, things will even out.
As proof that things will even out, here is last year's top-10 in terms of overall Team Impact (efficiency impact times minutes-on-the-floor%). We can call this the Holy Grail 3.0
I hope most people wouldn't have a problem with this list.
So here are the current numbers, which are now split into offense and defense...separated by the Top-26 Major Conference Players and the Top 26 not-so-Major Conferences. (Had to include the older Zeller. It's the law.)
Major:

Not-So-Major:
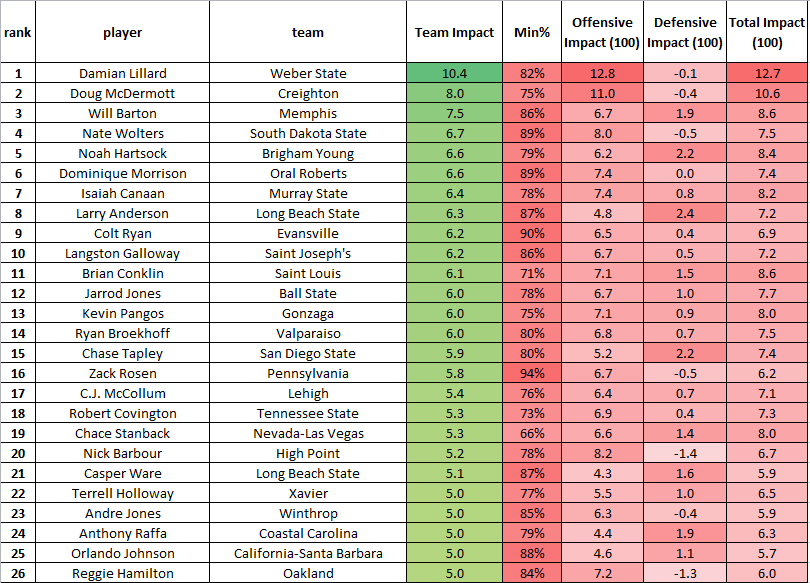
Notice I refrained from ranking players by their per-possession numbers...I think these are more intuitive and represent Player-of-the-Year candidates (if your coach didn't play you enough, you unfortunately didn't impact your team enough).
And look, Hummel is on a list! Now everyone can be happy. Even me!
* My method involved dividing advanced statistics such as Steal%, Assist%, or Offensive Rating by their league average. My NBA numbers had extremely high sample sizes and didn't have any problem with skewed numbers...here we have that problem a lot more, especially in smaller categories (such as Steal%) rather than larger categories (the more all-encompassing "Offensive Rating").
My prior post has sparked a little bit of interest/intrigue/outrage/fear among college basketball fans.
Never fear! Happier numbers are on the way.
First, let me reiterate that these are based on advanced stats only, such as offensive rating and defensive rating, from Sports-Reference.com. There are no plus-minus stats involved.
I realized that there were some pretty important adjustments that needed to be made. First, that players with extremely high numbers in any one category were being skewed.* Second, that the strength of schedule adjustment was a little counter-intuitive, and a little too strong. I adjusted my ratings thusly.
Unfortunately, the sample size for this season does not produce very intuitive results at the moment, which I should have mentioned in my last post (so please don't destroy me for anything that looks strange...just chew on it). For example, that Weber State's Damian Lillard is number one in the system. While I am a huge fan of Lillard and would have no problem listing him up there at the end of the year if things remain the same, I am wary of the fact that his team impact is two full points higher than the next-highest (and his per-possession impact is higher than Sullinger's). As major-conference teams improve their strength of schedules during conference play and players get more minutes, things will even out.
As proof that things will even out, here is last year's top-10 in terms of overall Team Impact (efficiency impact times minutes-on-the-floor%). We can call this the Holy Grail 3.0
| Player | School | Impact(100) | Team Eff. Impact |
| Kemba Walker | Connecticut | 13.1 | 12.1 |
| Jordan Taylor | Wisconsin | 12.4 | 11.2 |
| Talor Battle | Penn State | 10.3 | 9.8 |
| Jimmer Fredette | Brigham Young | 11.0 | 9.7 |
| Jared Sullinger | Ohio State | 12.2 | 9.6 |
| JaJuan Johnson | Purdue | 10.4 | 9.2 |
| Derrick Williams | Arizona | 11.8 | 8.7 |
| Jon Leuer | Wisconsin | 10.4 | 8.7 |
| Ben Hansbrough | Notre Dame | 9.7 | 8.4 |
| Jon Diebler | Ohio State | 9.3 | 8.3 |
I hope most people wouldn't have a problem with this list.
So here are the current numbers, which are now split into offense and defense...separated by the Top-26 Major Conference Players and the Top 26 not-so-Major Conferences. (Had to include the older Zeller. It's the law.)
Major:
Not-So-Major:
Notice I refrained from ranking players by their per-possession numbers...I think these are more intuitive and represent Player-of-the-Year candidates (if your coach didn't play you enough, you unfortunately didn't impact your team enough).
And look, Hummel is on a list! Now everyone can be happy. Even me!
* My method involved dividing advanced statistics such as Steal%, Assist%, or Offensive Rating by their league average. My NBA numbers had extremely high sample sizes and didn't have any problem with skewed numbers...here we have that problem a lot more, especially in smaller categories (such as Steal%) rather than larger categories (the more all-encompassing "Offensive Rating").
The Holy Grail 2.5: NCAA Player Ratings (1/4/2012)
EDIT: I have updated my methodology and made things a little easier to understand, I hope: http://www.thebasketballdistribution.com/2012/01/no-apologies-just-numbers.html
Now that Sports-Reference.com uses the same advanced stats for NBA and College players, it has become very simple and straightforward to create a statistical +/- based on advanced stats for college players.
BORING STUFF:
In order to adjust for college, I simply use each advanced stat* divided by its league average. Then, applying the same to college works well. I fit the 2010-2011 season's worth of raw statistical +/- data to each team's efficiency margin, and then to their adjusted efficiency margin. I then built a model that combines raw statistical +/- and team strength of schedule (simply Adjusted Efficiency Margin mins Raw Efficiency Margin, via kenpom.com) to give us an "adjusted Statistical +/-" that we will call (as we have before) Efficiency Impact.
/END BORING STUFF
For each player, we can look at Efficiency Impact per 100-possessions, and Team Efficiency Impact(their efficiency impact times the % of their team's possessions they played in).
Here are the top 100 players in both of those categories. First, efficiency impact per 100 possessions (25% of teams' minutes played to qualify)
Quite a few mid-majors at the top here, but the strength-of-schedule adjustment is well-calibrated. These will probably match somewhat closely to Pomeroy's "KPOY."
* - My raw regression involves Defensive Rating, Offensive Rating, Usage%, Assist%, and Steal%.
Now that Sports-Reference.com uses the same advanced stats for NBA and College players, it has become very simple and straightforward to create a statistical +/- based on advanced stats for college players.
BORING STUFF:
In order to adjust for college, I simply use each advanced stat* divided by its league average. Then, applying the same to college works well. I fit the 2010-2011 season's worth of raw statistical +/- data to each team's efficiency margin, and then to their adjusted efficiency margin. I then built a model that combines raw statistical +/- and team strength of schedule (simply Adjusted Efficiency Margin mins Raw Efficiency Margin, via kenpom.com) to give us an "adjusted Statistical +/-" that we will call (as we have before) Efficiency Impact.
/END BORING STUFF
For each player, we can look at Efficiency Impact per 100-possessions, and Team Efficiency Impact(their efficiency impact times the % of their team's possessions they played in).
Here are the top 100 players in both of those categories. First, efficiency impact per 100 possessions (25% of teams' minutes played to qualify)
| rank | player | team | Efficiency Impact/100 |
|---|---|---|---|
| 1 | Jared Sullinger | Ohio State | 19.4 |
| 2 | Russ Smith | Louisville | 16.8 |
| 3 | Thomas Robinson | Kansas | 15.8 |
| 4 | Damian Lillard | Weber State | 15.8 |
| 5 | Mike Scott | Virginia | 14.9 |
| 6 | Dion Waiters | Syracuse | 14.7 |
| 7 | James Southerland | Syracuse | 14.0 |
| 8 | JaMychal Green | Alabama | 13.9 |
| 9 | Cody Zeller | Indiana | 13.7 |
| 10 | C.J. McCollum | Lehigh | 13.6 |
| 11 | Marcus Denmon | Missouri | 13.4 |
| 12 | Anthony Davis | Kentucky | 13.2 |
| 13 | Jae Crowder | Marquette | 13.2 |
| 14 | Jared Berggren | Wisconsin | 13.1 |
| 15 | Isaiah Canaan | Murray State | 12.9 |
| 16 | Jarrod Jones | Ball State | 12.8 |
| 17 | Brian Conklin | Saint Louis | 12.5 |
| 18 | Jamaal Franklin | San Diego State | 12.4 |
| 19 | Ryan Pearson | George Mason | 12.1 |
| 20 | Herb Pope | Seton Hall | 11.7 |
| 21 | Doug McDermott | Creighton | 11.5 |
| 22 | Arsalan Kazemi | Rice | 11.4 |
| 23 | Kevin Jones | West Virginia | 11.4 |
| 24 | Anthony Raffa | Coastal Carolina | 11.3 |
| 25 | Miguel Paul | East Carolina | 11.3 |
| 26 | Chase Tapley | San Diego State | 11.2 |
| 27 | Ricardo Ratliffe | Missouri | 11.2 |
| 28 | Ryan Evans | Wisconsin | 11.1 |
| 29 | Henry Sims | Georgetown | 11.1 |
| 30 | Draymond Green | Michigan State | 10.9 |
| 31 | Cody Ellis | Saint Louis | 10.8 |
| 32 | Luke Martinez | Wyoming | 10.6 |
| 33 | Jereal Scott | Stephen F. Austin | 10.6 |
| 34 | Noah Hartsock | Brigham Young | 10.5 |
| 35 | Mike Moser | Nevada-Las Vegas | 10.5 |
| 36 | Tyler Zeller | North Carolina | 10.4 |
| 37 | Carlos Lopez | Nevada-Las Vegas | 10.4 |
| 38 | Quinn Cook | Duke | 10.3 |
| 39 | Will Barton | Memphis | 10.3 |
| 40 | Kris Joseph | Syracuse | 10.3 |
| 41 | Rob Jones | Saint Mary's (CA) | 10.2 |
| 42 | Dominique Sutton | North Carolina Central | 10.2 |
| 43 | Jordan Taylor | Wisconsin | 10.2 |
| 44 | Jason Clark | Georgetown | 10.2 |
| 45 | Ian Hummer | Princeton | 10.2 |
| 46 | Steven Werner | Sam Houston State | 10.1 |
| 47 | Leonard Washington | Wyoming | 10.1 |
| 48 | Robert Covington | Tennessee State | 10.1 |
| 49 | Drew Gordon | New Mexico | 10.0 |
| 50 | P.J. Hairston | North Carolina | 10.0 |
| 51 | Trevor Releford | Alabama | 9.9 |
| 52 | Tony Mitchell | Alabama | 9.9 |
| 53 | Ryan Kelly | Duke | 9.8 |
| 54 | William Buford | Ohio State | 9.8 |
| 55 | Terrell Holloway | Xavier | 9.7 |
| 56 | Kenny Boynton | Florida | 9.7 |
| 57 | Harrison Barnes | North Carolina | 9.7 |
| 58 | John Henson | North Carolina | 9.7 |
| 59 | Terell Parks | Western Illinois | 9.6 |
| 60 | Victor Oladipo | Indiana | 9.6 |
| 61 | Carl Hall | Wichita State | 9.5 |
| 62 | Deshaun Thomas | Ohio State | 9.4 |
| 63 | Davante Gardner | Marquette | 9.4 |
| 64 | Ken Horton | Central Connecticut State | 9.4 |
| 65 | Javon McCrea | Buffalo | 9.4 |
| 66 | Joe Ragland | Wichita State | 9.4 |
| 67 | D'Aundray Brown | Cleveland State | 9.4 |
| 68 | Michael Kidd-Gilchrist | Kentucky | 9.3 |
| 69 | Steven Pledger | Oklahoma | 9.3 |
| 70 | Donte Poole | Murray State | 9.3 |
| 71 | Robbie Hummel | Purdue | 9.3 |
| 72 | Brandon Fortenberry | Southeastern Louisiana | 9.3 |
| 73 | Doron Lamb | Kentucky | 9.3 |
| 74 | Khris Middleton | Texas A&M | 9.2 |
| 75 | Evan Smotrycz | Michigan | 9.1 |
| 76 | Jackie Carmichael | Illinois State | 9.1 |
| 77 | Jorge Gutierrez | California | 9.0 |
| 78 | Chace Stanback | Nevada-Las Vegas | 9.0 |
| 79 | Velton Jones | Robert Morris | 9.0 |
| 80 | Jaquon Parker | Cincinnati | 9.0 |
| 81 | Kenton Walker | Saint Mary's (CA) | 8.9 |
| 82 | Kevin Pangos | Gonzaga | 8.9 |
| 83 | Erick Green | Virginia Tech | 8.9 |
| 84 | Quincy Acy | Baylor | 8.8 |
| 85 | Nate Wolters | South Dakota State | 8.8 |
| 86 | Mark Lyons | Xavier | 8.8 |
| 87 | Arnett Moultrie | Mississippi State | 8.8 |
| 88 | D.J. Cooper | Ohio | 8.7 |
| 89 | Sheldon McClellan | Texas | 8.7 |
| 90 | Jamar Samuels | Kansas State | 8.7 |
| 91 | Hollis Thompson | Georgetown | 8.7 |
| 92 | Trevor Mbakwe | Minnesota | 8.7 |
| 93 | Reggie Bullock | North Carolina | 8.7 |
| 94 | Tony Snell | New Mexico | 8.7 |
| 95 | Jamal Fenton | New Mexico | 8.7 |
| 96 | Brad Waldow | Saint Mary's (CA) | 8.6 |
| 97 | Scott Saunders | Belmont | 8.6 |
| 98 | Mike Dixon, | Missouri | 8.6 |
| 99 | Maurice Kemp | East Carolina | 8.5 |
| 100 | Jamar Gulley | Missouri State | 8.5 |
| rank | player | team | Team Efficiency Impact | Efficiency Impact/100 | Min% |
|---|---|---|---|---|---|
| 1 | Thomas Robinson | Kansas | 12.3 | 15.8 | 77.7% |
| 2 | Damian Lillard | Weber State | 12.1 | 15.8 | 76.8% |
| 3 | Jared Sullinger | Ohio State | 11.8 | 19.4 | 61.0% |
| 4 | Jarrod Jones | Ball State | 11.3 | 12.8 | 88.6% |
| 5 | Mike Scott | Virginia | 10.7 | 14.9 | 72.2% |
| 6 | Marcus Denmon | Missouri | 10.5 | 13.4 | 78.6% |
| 7 | C.J. McCollum | Lehigh | 10.4 | 13.6 | 76.3% |
| 8 | Kevin Jones | West Virginia | 10.1 | 11.4 | 88.8% |
| 9 | Isaiah Canaan | Murray State | 9.8 | 12.9 | 76.1% |
| 10 | Herb Pope | Seton Hall | 9.7 | 11.7 | 83.2% |
| 11 | Anthony Davis | Kentucky | 9.5 | 13.2 | 72.3% |
| 12 | Anthony Raffa | Coastal Carolina | 9.5 | 11.3 | 84.1% |
| 13 | Cody Zeller | Indiana | 9.2 | 13.7 | 67.1% |
| 14 | Chase Tapley | San Diego State | 9.0 | 11.2 | 80.7% |
| 15 | Jae Crowder | Marquette | 9.0 | 13.2 | 68.2% |
| 16 | Draymond Green | Michigan State | 8.8 | 10.9 | 80.9% |
| 17 | Jordan Taylor | Wisconsin | 8.8 | 10.2 | 86.4% |
| 18 | Ryan Pearson | George Mason | 8.8 | 12.1 | 72.9% |
| 19 | Brian Conklin | Saint Louis | 8.7 | 12.5 | 69.6% |
| 20 | Jared Berggren | Wisconsin | 8.7 | 13.1 | 66.7% |
| 21 | Ian Hummer | Princeton | 8.6 | 10.2 | 84.5% |
| 22 | Will Barton | Memphis | 8.6 | 10.3 | 83.2% |
| 23 | Miguel Paul | East Carolina | 8.5 | 11.3 | 74.7% |
| 24 | Rob Jones | Saint Mary's (CA) | 8.4 | 10.2 | 82.2% |
| 25 | Noah Hartsock | Brigham Young | 8.3 | 10.5 | 78.6% |
| 26 | Doug McDermott | Creighton | 8.2 | 11.5 | 71.1% |
| 27 | William Buford | Ohio State | 8.2 | 9.8 | 83.5% |
| 28 | Russ Smith | Louisville | 8.2 | 16.8 | 48.4% |
| 29 | Dominique Sutton | North Carolina Central | 8.1 | 10.2 | 78.9% |
| 30 | Tony Mitchell | Alabama | 7.9 | 9.9 | 80.0% |
| 31 | Dion Waiters | Syracuse | 7.8 | 14.7 | 53.2% |
| 32 | Nate Wolters | South Dakota State | 7.8 | 8.8 | 88.6% |
| 33 | Ryan Evans | Wisconsin | 7.7 | 11.1 | 68.8% |
| 34 | Robert Covington | Tennessee State | 7.6 | 10.1 | 75.5% |
| 35 | Mike Moser | Nevada-Las Vegas | 7.6 | 10.5 | 72.5% |
| 36 | Kenny Boynton | Florida | 7.6 | 9.7 | 78.0% |
| 37 | Ken Horton | Central Connecticut State | 7.6 | 9.4 | 80.4% |
| 38 | JaMychal Green | Alabama | 7.5 | 13.9 | 54.0% |
| 39 | D'Aundray Brown | Cleveland State | 7.5 | 9.4 | 80.4% |
| 40 | Jason Clark | Georgetown | 7.5 | 10.2 | 73.6% |
| 41 | Arsalan Kazemi | Rice | 7.5 | 11.4 | 65.2% |
| 42 | Drew Gordon | New Mexico | 7.4 | 10.0 | 74.0% |
| 43 | Kris Joseph | Syracuse | 7.4 | 10.3 | 72.2% |
| 44 | Terrell Holloway | Xavier | 7.4 | 9.7 | 76.0% |
| 45 | Jordan Theodore | Seton Hall | 7.4 | 7.7 | 95.9% |
| 46 | Jereal Scott | Stephen F. Austin | 7.4 | 10.6 | 69.8% |
| 47 | Jamaal Franklin | San Diego State | 7.2 | 12.4 | 57.7% |
| 48 | Trevor Releford | Alabama | 7.1 | 9.9 | 71.9% |
| 49 | Michael Kidd-Gilchrist | Kentucky | 7.1 | 9.3 | 76.2% |
| 50 | Doron Lamb | Kentucky | 7.1 | 9.3 | 76.2% |
| 51 | Robbie Hummel | Purdue | 7.0 | 9.3 | 75.5% |
| 52 | Deshaun Thomas | Ohio State | 7.0 | 9.4 | 74.2% |
| 53 | Larry Anderson | Long Beach State | 6.9 | 7.9 | 87.1% |
| 54 | Tim Frazier | Penn State | 6.9 | 7.7 | 89.2% |
| 55 | Terell Parks | Western Illinois | 6.9 | 9.6 | 71.8% |
| 56 | D.J. Cooper | Ohio | 6.8 | 8.7 | 78.2% |
| 57 | Jeremy Lamb | Connecticut | 6.8 | 8.1 | 84.1% |
| 58 | Kevin Pangos | Gonzaga | 6.8 | 8.9 | 76.7% |
| 59 | Langston Galloway | Saint Joseph's | 6.8 | 7.9 | 85.8% |
| 60 | Edwin Fuquan | Seton Hall | 6.8 | 7.6 | 89.7% |
| 61 | Greg Mangano | Yale | 6.8 | 8.0 | 85.2% |
| 62 | J'Covan Brown | Texas | 6.8 | 8.0 | 84.6% |
| 63 | Ricardo Ratliffe | Missouri | 6.8 | 11.2 | 60.5% |
| 64 | Henry Sims | Georgetown | 6.8 | 11.1 | 61.0% |
| 65 | Ryan Broekhoff | Valparaiso | 6.7 | 8.5 | 79.2% |
| 66 | Erick Green | Virginia Tech | 6.7 | 8.9 | 75.4% |
| 67 | Tyler Zeller | North Carolina | 6.7 | 10.4 | 64.3% |
| 68 | Velton Jones | Robert Morris | 6.7 | 9.0 | 74.0% |
| 69 | John Henson | North Carolina | 6.6 | 9.7 | 68.8% |
| 70 | Luke Martinez | Wyoming | 6.6 | 10.6 | 62.9% |
| 71 | Donte Poole | Murray State | 6.6 | 9.3 | 71.3% |
| 72 | Isaiah Wilkerson | NJIT | 6.6 | 7.8 | 84.6% |
| 73 | Jared Cunningham | Oregon State | 6.5 | 7.7 | 84.5% |
| 74 | Dominique Morrison | Oral Roberts | 6.5 | 7.3 | 88.6% |
| 75 | Julian Mavunga | Miami (OH) | 6.4 | 5.9 | 108.9% |
| 76 | Steven Pledger | Oklahoma | 6.4 | 9.3 | 68.7% |
| 77 | Drew Crawford | Northwestern | 6.4 | 7.6 | 83.8% |
| 78 | Quincy Acy | Baylor | 6.3 | 8.8 | 71.9% |
| 79 | Javon McCrea | Buffalo | 6.3 | 9.4 | 67.4% |
| 80 | Bradford Burgess | Virginia Commonwealth | 6.3 | 7.9 | 80.0% |
| 81 | Hollis Thompson | Georgetown | 6.3 | 8.7 | 72.5% |
| 82 | Leonard Washington | Wyoming | 6.3 | 10.1 | 62.3% |
| 83 | Harrison Barnes | North Carolina | 6.3 | 9.7 | 65.0% |
| 84 | Jorge Gutierrez | California | 6.2 | 9.0 | 68.8% |
| 85 | John Jenkins | Vanderbilt | 6.2 | 8.2 | 76.0% |
| 86 | Ryan Kelly | Duke | 6.2 | 9.8 | 62.9% |
| 87 | Aaron Craft | Ohio State | 6.2 | 8.0 | 77.7% |
| 88 | Victor Oladipo | Indiana | 6.2 | 9.6 | 64.6% |
| 89 | Matthew Dellavedova | Saint Mary's (CA) | 6.2 | 6.8 | 91.1% |
| 90 | Reggie Hamilton | Oakland | 6.1 | 7.2 | 85.9% |
| 91 | Andre Roberson | Colorado | 6.1 | 8.5 | 71.8% |
| 92 | Joe Harris | Virginia | 6.1 | 8.0 | 75.9% |
| 93 | Colt Ryan | Evansville | 6.0 | 7.5 | 80.7% |
| 94 | Sean Kilpatrick | Cincinnati | 6.0 | 7.1 | 84.4% |
| 95 | Mike Muscala | Bucknell | 6.0 | 7.6 | 78.8% |
| 96 | Kerron Johnson | Belmont | 6.0 | 8.4 | 71.4% |
| 97 | Tony Snell | New Mexico | 5.9 | 8.7 | 68.3% |
| 98 | Chace Stanback | Nevada-Las Vegas | 5.9 | 9.0 | 65.8% |
| 99 | Jeffery Taylor | Vanderbilt | 5.9 | 7.7 | 77.0% |
| 100 | DeAndre Kane | Marshall | 5.9 | 7.2 | 81.9% |
Quite a few mid-majors at the top here, but the strength-of-schedule adjustment is well-calibrated. These will probably match somewhat closely to Pomeroy's "KPOY."
* - My raw regression involves Defensive Rating, Offensive Rating, Usage%, Assist%, and Steal%.
NCAA Power Ratings
I now have my own usually-updated NCAA power ratings. (Located at the top of the page).
These are simply based on point margin, and I adjust for consistency, recency, and which teams appear to play up or down to their opponents (i.e. fixing the issue of cupcake-killers), in the spirit of the work of DSMok1 aka Daniel.
"Original Rating" is basically SRS, simply adjusting a team's point differential by their opponent's point differential several layers down.
"Quality Rating" weighs each opponent/game by their "original rating" and whether or not a game was at home or away. The final result of a very difficult game is worth the most in this average, and the final result of a very easy game impacts this the least.
"Cupcake Rating" does the exact opposite of "quality rating."
Finally, each team is ranked by using my expected outcome (from Quality/Cupcake/Original ratings) against the top-25 "Original" teams. This gives us a basic idea of how teams might fare come March.
These are simply based on point margin, and I adjust for consistency, recency, and which teams appear to play up or down to their opponents (i.e. fixing the issue of cupcake-killers), in the spirit of the work of DSMok1 aka Daniel.
"Original Rating" is basically SRS, simply adjusting a team's point differential by their opponent's point differential several layers down.
"Quality Rating" weighs each opponent/game by their "original rating" and whether or not a game was at home or away. The final result of a very difficult game is worth the most in this average, and the final result of a very easy game impacts this the least.
"Cupcake Rating" does the exact opposite of "quality rating."
Finally, each team is ranked by using my expected outcome (from Quality/Cupcake/Original ratings) against the top-25 "Original" teams. This gives us a basic idea of how teams might fare come March.
Subscribe to:
Posts (Atom)