 |
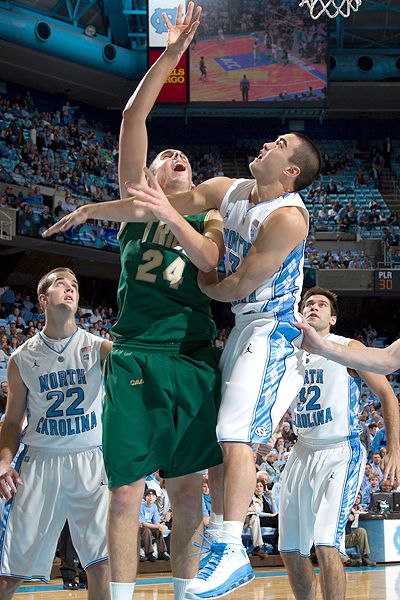
| UNC's Blue Steel scrubs. Photo 100% stolen from ESPN.com |
a) the scrubs begin playing
b) teams try and make a comeback despite a mighty deficit...tons of free throw shooting that could skew the point margin in either team's favor
c) the winning team doesn't care about playing anymore, really...
d) etc
Bill James (of baseball stats fame) introduced his own simple metric that StatSheet.com uses, and succeeds rather invariably: Lead "Safeness." Bill James also refers to Coach K as "the human typo" in that article. I love him.
Anyways, the math is pretty straightforward (I remove the bit about who has the ball to make it easier to calculate, as it averages to zero):
(Point Margin - 3)^2 / Seconds Remaining = % Safe
So we do a little algebra, and we can quickly estimate point margin when the lead became 100% safe:
Point Margin =Sqrt(seconds remaining when safe) + 3
Which we then use to forecast the rest of the game, ignoring how it actually played out:
Adjusted Final Margin = [sqrt(Seconds Remaining when safe)+3] x 40 / [40-(Seconds Remaining when safe/60)]
You can easily find "seconds remaining when safe" via StatSheet.com. For example, last night's UNC-Wake Forest Game was "statistically over" with 3:48 left to go. Plus this in to my handy-dandy spreadsheet, and you get:
Point Margin When Safe: ~18
Adjusted Final Point Margin: 20
So while the Heels only won by 15, they had plenty of room to let the game slide in the final minutes - if they had played with the same quality all the way through they would have won by around 20.

No comments:
Post a Comment