| Player | Team | PS | %mins | raw SPR(2.0) per 100 | on-off | adjRating | WARP82 | Salary | |
|---|---|---|---|---|---|---|---|---|---|
| 1 | thomas,isaiah | sac | PG | 63% | 5.8 | 12.0 | 4.2 | 13.0 | $884,293.00 |
| 2 | parsons,chandler | hou | SF | 70% | 2.2 | 1.1 | 1.3 | 9.2 | $926,500.00 |
| 3 | blair,dejuan | dal | C | 44% | 3.4 | 1.2 | 1.6 | 6.2 | $884,293.00 |
| 4 | casspi,omri | hou | SF | 42% | 0.7 | 11.1 | 1.3 | 5.5 | $947,907.00 |
| 5 | middleton,khris | mil | SF | 56% | -0.7 | 12.2 | -0.7 | 4.4 | $788,872.00 |
| 6 | tucker,p.j. | pho | SG | 65% | -1.0 | -3.8 | -1.0 | 4.4 | $884,293.00 |
| 7 | henry,xavier | lal | SG | 42% | -0.5 | 14.1 | 0.2 | 4.2 | $884,293.00 |
| 8 | beverley,patrick | hou | PG | 59% | -1.8 | 4.9 | -0.9 | 4.0 | $788,872.00 |
| 9 | johnson,wesley | lal | SG | 54% | -0.4 | -6.3 | -0.8 | 4.0 | $884,293.00 |
| 10 | farmar,jordan | lal | PG | 28% | 3.7 | 15.4 | 1.3 | 3.7 | $884,293.00 |
| 11 | green,draymond | gsw | SF | 42% | -1.2 | 6.3 | -0.4 | 3.6 | $875,500.00 |
| 12 | brooks,aaron | hou | PG | 26% | 1.9 | -6.5 | 0.3 | 2.7 | $884,293.00 |
| 13 | livingston,shaun | bro | PG | 46% | -0.6 | 1.3 | -1.5 | 2.5 | $884,293.00 |
| 14 | williams,shawne | lal | SF | 37% | -3.2 | 14.4 | -1.0 | 2.5 | $884,293.00 |
| 15 | crowder,jae | dal | SF | 37% | -1.5 | 11.7 | -1.1 | 2.4 | $788,872.00 |
| 16 | mack,shelvin | atl | PG | 28% | 1.6 | 10.7 | -0.6 | 2.2 | $884,293.00 |
| 17 | fisher,derek | okl | PG | 27% | -4.3 | 0.9 | -0.4 | 2.2 | $884,293.00 |
| 18 | leuer,jon | mem | PF | 27% | 1.7 | 0.8 | -0.6 | 2.1 | $900,000.00 |
| 19 | martin,kenyon | nyk | PF | 31% | 0.4 | 10.9 | -1.1 | 2.0 | $884,293.00 |
| 20 | hummel,robbie | min | SF | 19% | -3.5 | 0.0 | -0.8 | 1.4 | $490,180.00 |

Cheapo All-stars
Here are the players with the most Wins Above Replacement (expanded to 82 games) for under $1 million. This is based on my new Adjusted Rating which is a combination of stats and +/-.
Leaders in Points-Created
Hey All!
Using Dean Oliver's formula for estimated "assisted-shot%" (recounted here) and some other basic stats, I've come up with some handy quick-n-dirty numbers early in the 2014 (GAMES AS OF 11/18/2013)
"Points Created"
This number combines: Points from field-goals (not-assisted on), Points from free throws, and assists multiplied by the average points per team field goal made (typically around 2.1).
"Possessions Used"
This number combines: Field goal attempts minus assisted field-goal-makes, 44% of Free Throw Attempts, assists, and turnovers
From these I got Per-100-possession stats, including "Points Created Per 100 above positional average" to help normalize for position (especially useful for finding who the best passers & scorers are for their position). Also I'll be showing Points Created / Points Used (Points Per Possession).
Here you go!
Top-10 Most Possessions Used Per 100:

Top-10 Points Created / Points Used (Points Per Possession):

Top-10 Points Created Per 100:
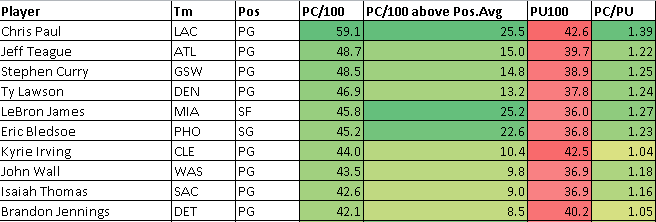
Top-10 Points Created Per 100 (Above Positional Average):

Using Dean Oliver's formula for estimated "assisted-shot%" (recounted here) and some other basic stats, I've come up with some handy quick-n-dirty numbers early in the 2014 (GAMES AS OF 11/18/2013)
"Points Created"
This number combines: Points from field-goals (not-assisted on), Points from free throws, and assists multiplied by the average points per team field goal made (typically around 2.1).
"Possessions Used"
This number combines: Field goal attempts minus assisted field-goal-makes, 44% of Free Throw Attempts, assists, and turnovers
From these I got Per-100-possession stats, including "Points Created Per 100 above positional average" to help normalize for position (especially useful for finding who the best passers & scorers are for their position). Also I'll be showing Points Created / Points Used (Points Per Possession).
Here you go!
Top-10 Most Possessions Used Per 100:
Top-10 Points Created / Points Used (Points Per Possession):
Top-10 Points Created Per 100:
Top-10 Points Created Per 100 (Above Positional Average):
NBA Projections v1.0 - "The Three Facets"
Happy NBA day everyone!
There are three different projections I have here.
-First is "playoff adjusted efficiency differential" - which estimates how a lineup minutes will alter during the playoffs and adjusts accordingly.
-Second is "regular season eff. differential" - which includes the raw lineup of players and minutes projections
-Third is projected wins, which takes the 2nd and applies it to this season's schedule.

Notes:
-Yes, I did adjust Cleveland so Varejao gets more minutes and Clark gets less.
-Enjoy responsibly!
There are three different projections I have here.
-First is "playoff adjusted efficiency differential" - which estimates how a lineup minutes will alter during the playoffs and adjusts accordingly.
-Second is "regular season eff. differential" - which includes the raw lineup of players and minutes projections
-Third is projected wins, which takes the 2nd and applies it to this season's schedule.
Notes:
-Yes, I did adjust Cleveland so Varejao gets more minutes and Clark gets less.
-Enjoy responsibly!
The Basketball Distribution Season Projections v0.2, (Earl Clark Edition)
Changes
-Slight somewhat arbitrary adjustment for Usage (i.e. Brooklyn's 112% usage ain't gonna work).
-Beasley's minutes cut from 30% to 10%
-Fixed some errant players that aren't projected to be in the league
The main issue I see here is that my minutes projection has Earl Clark fronting a TON of minutes for Cleveland, and that Varejao is (understandably) projected to sustain some injuries. I'll hopefully adjust this some. I also think my xRAPM projection for Earl Clark is unfairly low.
Added "Starters Wins Added" and "Bench Wins Added" which is the combined contribution of "wins above 41" by the starters (top-5 minutes) and bench (the rest).
The Basketball Distribution Season Projections v0.1, (The "Laugh it up, fuzzball" Edition)
I'll go ahead and admit right off the bat that this does not pass the laugh test.
For obvious reasons (Miami), my projections will make you chuckle a little.
While my player values are likely very accurate (projections for xRAPM), my minutes projections are not. I have a feeling that Ray Allen and Michael Beasley and Norris Cole will all get less playing time this season than my source for minutes suggests.
EDIT: IMPORTANT OTHER NOTICE: This doesn't take into account offenses who won't be able to use as many possessions as their new players inherently use (i.e. Brooklyn).
Without further ado, here they be:

Eff differential = Expected win differential based on projected xRAPM and projected minutes for all players.
pWins = Pythagorean wins, or, the # of wins expected were all teams to play an even schedule
>Avg Players = Total projected contribution of all above-zero xRAPM players
Total projected contribution of all below-zero xRAPM players
Bench win differential = how much the below average players on a team impact expected win total, versus the league average.

Miami's below-average players are...ahem...not awesome.
For obvious reasons (Miami), my projections will make you chuckle a little.
While my player values are likely very accurate (projections for xRAPM), my minutes projections are not. I have a feeling that Ray Allen and Michael Beasley and Norris Cole will all get less playing time this season than my source for minutes suggests.
EDIT: IMPORTANT OTHER NOTICE: This doesn't take into account offenses who won't be able to use as many possessions as their new players inherently use (i.e. Brooklyn).
Without further ado, here they be:
Eff differential = Expected win differential based on projected xRAPM and projected minutes for all players.
pWins = Pythagorean wins, or, the # of wins expected were all teams to play an even schedule
>Avg Players = Total projected contribution of all above-zero xRAPM players
Bench win differential = how much the below average players on a team impact expected win total, versus the league average.
Miami's below-average players are...ahem...not awesome.
Projected xRAPM for 2014
MATH: I created a model based on aging curve, regression to the mean, and regression towards prior performance (up to 3 seasons in the past). A player with three seasons' worth of data will be slightly more accurate than one with two, etcetera. Those are the only factors this takes into account. The R^2 of the regression model for the ~2000 data points I used was around 0.75.
Enjoy!
| Projected xRAPM (model) | range (-1.5 to +1.5 SDs) | |
|---|---|---|
| LeBron James | 9.5 | 7.5 / 11.5 |
| Chris Paul | 7.7 | 5.7 / 9.8 |
| Kevin Durant | 7.7 | 5.6 / 9.7 |
| Tim Duncan | 6.3 | 4.2 / 8.3 |
| Dwight Howard | 5.9 | 3.9 / 8.0 |
| Kevin Love | 5.3 | 3.3 / 7.3 |
| Marc Gasol | 5.0 | 3.0 / 7.0 |
| James Harden | 4.9 | 2.8 / 6.9 |
| Russell Westbrook | 4.9 | 2.8 / 6.9 |
| Paul Millsap | 4.7 | 2.7 / 6.7 |
| Blake Griffin | 4.7 | 2.6 / 6.7 |
| Tyson Chandler | 4.4 | 2.4 / 6.5 |
| Mike Conley | 4.4 | 2.4 / 6.4 |
| Chris Andersen | 4.4 | 2.3 / 6.4 |
| Amir Johnson | 4.3 | 2.2 / 6.3 |
| Dwyane Wade | 4.1 | 2.1 / 6.2 |
| Stephen Curry | 3.9 | 1.9 / 6.0 |
| Joakim Noah | 3.9 | 1.9 / 5.9 |
| Roy Hibbert | 3.7 | 1.7 / 5.7 |
| Dirk Nowitzki | 3.7 | 1.6 / 5.7 |
| Omer Asik | 3.7 | 1.6 / 5.7 |
| Danilo Gallinari | 3.5 | 1.5 / 5.6 |
| Kevin Garnett | 3.5 | 1.5 / 5.6 |
| Andre Iguodala | 3.5 | 1.5 / 5.6 |
| Manu Ginobili | 3.5 | 1.5 / 5.5 |
| Andrew B | 3.4 | 1.4 / 5.4 |
| Josh Smith | 3.4 | 1.3 / 5.4 |
| Kyle Lowry | 3.3 | 1.3 / 5.4 |
| Nene Hilario | 3.3 | 1.3 / 5.4 |
| Rajon Rondo | 3.3 | 1.2 / 5.3 |
| LaMarcus Aldridge | 3.2 | 1.2 / 5.3 |
| Ricky Rubio | 3.1 | 1.1 / 5.1 |
| DeAndre Jordan | 3.1 | 1.0 / 5.1 |
| Paul George | 3.0 | 1.0 / 5.1 |
| Anderson Varejao | 3.0 | 1.0 / 5.0 |
| Greg Monroe | 3.0 | 1.0 / 5.0 |
| Brook Lopez | 3.0 | 1.0 / 5.0 |
| John Wall | 2.9 | 0.9 / 4.9 |
| Paul Pierce | 2.9 | 0.9 / 4.9 |
| Serge Ibaka | 2.8 | 0.8 / 4.8 |
| Thaddeus Young | 2.7 | 0.7 / 4.7 |
| Andre Drummond | 2.7 | 0.7 / 4.7 |
| Derrick Favors | 2.6 | 0.6 / 4.6 |
| Tiago Splitter | 2.4 | 0.3 / 4.4 |
| Kobe Bryant | 2.3 | 0.3 / 4.3 |
| DeMarcus Cousins | 2.3 | 0.3 / 4.3 |
| Pau Gasol | 2.3 | 0.3 / 4.3 |
| David West | 2.2 | 0.2 / 4.3 |
| Larry Sanders | 2.2 | 0.1 / 4.2 |
| Tony Parker | 2.1 | 0.1 / 4.2 |
| Ersan Ilyasova | 2.1 | 0.1 / 4.1 |
| Vince Carter | 2.1 | 0.1 / 4.1 |
| Andrew Bogut | 2.0 | 0.0 / 4.0 |
| Andrei Kirilenko | 2.0 | 0.0 / 4.0 |
| Deron Williams | 2.0 | 0.0 / 4.0 |
| Taj Gibson | 2.0 | -0.1 / 4.0 |
| Kawhi Leonard | 1.8 | -0.2 / 3.8 |
| Al-Farouq Aminu | 1.8 | -0.3 / 3.8 |
| Chris Bosh | 1.7 | -0.3 / 3.8 |
| Carmelo Anthony | 1.7 | -0.3 / 3.7 |
| Kyrie Irving | 1.7 | -0.3 / 3.7 |
| Anthony Davis | 1.7 | -0.3 / 3.7 |
| Gerald Wallace | 1.7 | -0.4 / 3.7 |
| George Hill | 1.7 | -0.4 / 3.7 |
| Kenneth Faried | 1.6 | -0.4 / 3.7 |
| Jrue Holiday | 1.6 | -0.4 / 3.7 |
| Al Horford | 1.6 | -0.4 / 3.6 |
| Kosta Koufos | 1.6 | -0.4 / 3.6 |
| Luol Deng | 1.5 | -0.6 / 3.5 |
| JaVale McGee | 1.5 | -0.6 / 3.5 |
| Gordon Hayward | 1.5 | -0.6 / 3.5 |
| Robin Lopez | 1.5 | -0.6 / 3.5 |
| Brandan Wright | 1.4 | -0.6 / 3.4 |
| Eric Bledsoe | 1.4 | -0.6 / 3.4 |
| Greg | 1.4 | -0.6 / 3.4 |
| Ryan Anderson | 1.4 | -0.7 / 3.4 |
| Zach Randolph | 1.2 | -0.8 / 3.2 |
| Devin Harris | 1.1 | -0.9 / 3.1 |
| Nick Collison | 1.0 | -1.0 / 3.1 |
| Goran Dragic | 1.0 | -1.0 / 3.0 |
| Emeka Okafor | 1.0 | -1.1 / 3.0 |
| Danny Granger | 1.0 | -1.1 / 3.0 |
| Bismack Biyombo | 0.9 | -1.1 / 2.9 |
| Jimmy Butler | 0.9 | -1.1 / 2.9 |
| Tristan Thompson | 0.9 | -1.1 / 2.9 |
| Ekpe Udoh | 0.9 | -1.1 / 2.9 |
| Damian Lillard | 0.9 | -1.2 / 2.9 |
| Eric Gordon | 0.8 | -1.2 / 2.8 |
| Ty Lawson | 0.8 | -1.2 / 2.8 |
| Jason Kidd | 0.7 | -1.3 / 2.8 |
| Nicolas Batum | 0.7 | -1.3 / 2.7 |
| Steve Nash | 0.7 | -1.3 / 2.7 |
| David Lee | 0.7 | -1.3 / 2.7 |
| Al Jefferson | 0.7 | -1.3 / 2.7 |
| Michael Kidd-Gilchrist | 0.6 | -1.4 / 2.7 |
| Anthony Randolph | 0.6 | -1.4 / 2.6 |
| Tony Allen | 0.6 | -1.4 / 2.6 |
| Metta World Peace | 0.6 | -1.4 / 2.6 |
| Nikola Pekovic | 0.6 | -1.4 / 2.6 |
| Marcin Gortat | 0.6 | -1.5 / 2.6 |
| Jeremy Lin | 0.6 | -1.5 / 2.6 |
| J.R. Smith | 0.5 | -1.5 / 2.6 |
| Chuck Hayes | 0.5 | -1.5 / 2.6 |
| Jason Thompson | 0.5 | -1.5 / 2.6 |
| Lamar Odom | 0.5 | -1.5 / 2.5 |
| Jared Dudley | 0.5 | -1.5 / 2.5 |
| Elton Brand | 0.5 | -1.5 / 2.5 |
| Joe Johnson | 0.5 | -1.6 / 2.5 |
| Spencer Hawes | 0.5 | -1.6 / 2.5 |
| Raymond Felton | 0.5 | -1.6 / 2.5 |
| Quincy Acy | 0.4 | -1.6 / 2.5 |
| Wilson Chandler | 0.4 | -1.6 / 2.5 |
| Patrick Beverley | 0.4 | -1.6 / 2.4 |
| Tobias Harris | 0.4 | -1.6 / 2.4 |
| Kemba Walker | 0.4 | -1.6 / 2.4 |
| Andray Blatche | 0.4 | -1.6 / 2.4 |
| Monta Ellis | 0.4 | -1.7 / 2.4 |
| Rudy Gay | 0.4 | -1.7 / 2.4 |
| Danny Green | 0.4 | -1.7 / 2.4 |
| Tyreke Evans | 0.3 | -1.7 / 2.3 |
| Isaiah Thomas | 0.2 | -1.8 / 2.3 |
| Landry Fields | 0.2 | -1.8 / 2.2 |
| Enes Kanter | 0.2 | -1.9 / 2.2 |
| Gustavo Ayon | 0.2 | -1.9 / 2.2 |
| Reggie Evans | 0.1 | -1.9 / 2.2 |
| DeMarre Carroll | 0.1 | -1.9 / 2.1 |
| Dorell Wright | 0.1 | -1.9 / 2.1 |
| Jeff Teague | 0.1 | -1.9 / 2.1 |
| Matt Barnes | 0.1 | -1.9 / 2.1 |
| Kevin Martin | 0.1 | -1.9 / 2.1 |
| Ed Davis | 0.0 | -2.0 / 2.1 |
| Chase Budinger | 0.0 | -2.0 / 2.0 |
| Thabo Sefolosha | 0.0 | -2.0 / 2.0 |
| Mario Chalmers | 0.0 | -2.0 / 2.0 |
| Samuel Dalembert | 0.0 | -2.0 / 2.0 |
| Mike Dunleavy | 0.0 | -2.1 / 2.0 |
| Marcus Camby | -0.1 | -2.1 / 2.0 |
| Kyle Korver | -0.1 | -2.1 / 2.0 |
| James Anderson | -0.1 | -2.1 / 2.0 |
| Chandler Parsons | -0.1 | -2.1 / 1.9 |
| Louis Williams | -0.1 | -2.1 / 1.9 |
| Brandon Roy | -0.1 | -2.1 / 1.9 |
| Brendan Haywood | -0.1 | -2.2 / 1.9 |
| Josh Harrellson | -0.1 | -2.2 / 1.9 |
| Pablo Prigioni | -0.1 | -2.2 / 1.9 |
| Nikola Vucevic | -0.2 | -2.2 / 1.9 |
| Hamed Haddadi | -0.2 | -2.2 / 1.8 |
| Jameer Nelson | -0.2 | -2.2 / 1.8 |
| Lance Stephenson | -0.2 | -2.2 / 1.8 |
| Jared Sullinger | -0.2 | -2.2 / 1.8 |
| Wesley Matthews | -0.2 | -2.2 / 1.8 |
| John Henson | -0.3 | -2.3 / 1.8 |
| Andre Miller | -0.3 | -2.3 / 1.7 |
| Klay Thompson | -0.3 | -2.3 / 1.7 |
| Shane Battier | -0.4 | -2.4 / 1.7 |
| Harrison Barnes | -0.4 | -2.4 / 1.7 |
| Jonas Valanciunas | -0.4 | -2.4 / 1.7 |
| Luc Mbah a Moute | -0.4 | -2.4 / 1.6 |
| C.J. Miles | -0.4 | -2.4 / 1.6 |
| Zaza Pachulia | -0.4 | -2.5 / 1.6 |
| Jermaine O'Neal | -0.5 | -2.5 / 1.6 |
| DeJuan Blair | -0.5 | -2.5 / 1.6 |
| O.J. Mayo | -0.5 | -2.5 / 1.5 |
| Jose Calderon | -0.5 | -2.5 / 1.5 |
| Matt Bonner | -0.5 | -2.5 / 1.5 |
| Corey Brewer | -0.5 | -2.6 / 1.5 |
| Rodney Stuckey | -0.5 | -2.6 / 1.5 |
| Trevor Ariza | -0.5 | -2.6 / 1.5 |
| Greg Smith | -0.6 | -2.6 / 1.5 |
| Luis Scola | -0.6 | -2.6 / 1.5 |
| Chauncey Billups | -0.6 | -2.6 / 1.4 |
| Kris Humphries | -0.6 | -2.6 / 1.4 |
| Jeff Adrien | -0.7 | -2.7 / 1.4 |
| Rasheed Wallace | -0.7 | -2.7 / 1.3 |
| Kyle O'Quinn | -0.7 | -2.7 / 1.3 |
| DeMar DeRozan | -0.7 | -2.7 / 1.3 |
| Ramon Sessions | -0.7 | -2.7 / 1.3 |
| Josh McRoberts | -0.7 | -2.7 / 1.3 |
| Bradley Beal | -0.7 | -2.7 / 1.3 |
| Jason Smith | -0.7 | -2.8 / 1.3 |
| Omri Casspi | -0.8 | -2.8 / 1.3 |
| Carlos Delfino | -0.8 | -2.8 / 1.3 |
| Glen Davis | -0.8 | -2.8 / 1.2 |
| Ronnie Brewer | -0.8 | -2.8 / 1.2 |
| John Salmons | -0.8 | -2.8 / 1.2 |
| Amare Stoudemire | -0.8 | -2.8 / 1.2 |
| Gerald Henderson | -0.8 | -2.8 / 1.2 |
| Alec Burks | -0.8 | -2.8 / 1.2 |
| Derrick Williams | -0.8 | -2.9 / 1.2 |
| Greivis Vasquez | -0.8 | -2.9 / 1.2 |
| Jonas Jerebko | -0.9 | -2.9 / 1.2 |
| Hasheem Thabeet | -0.9 | -2.9 / 1.1 |
| Antawn Jamison | -0.9 | -2.9 / 1.1 |
| Patrick Patterson | -0.9 | -2.9 / 1.1 |
| Ronny Turiaf | -0.9 | -2.9 / 1.1 |
| Dion Waiters | -0.9 | -2.9 / 1.1 |
| Lavoy Allen | -0.9 | -3.0 / 1.1 |
| Jordan Hamilton | -1.0 | -3.0 / 1.1 |
| Brandon Knight | -1.0 | -3.0 / 1.1 |
| Greg Stiemsma | -1.0 | -3.0 / 1.1 |
| Vladimir Radmanovic | -1.0 | -3.0 / 1.0 |
| Kenyon Martin | -1.0 | -3.0 / 1.0 |
| Brandon Jennings | -1.0 | -3.0 / 1.0 |
| Boris Diaw | -1.0 | -3.0 / 1.0 |
| Tyler Hansbrough | -1.0 | -3.1 / 1.0 |
| Trevor Booker | -1.0 | -3.1 / 1.0 |
| Carlos Boozer | -1.1 | -3.1 / 0.9 |
| J.J. Hickson | -1.1 | -3.1 / 0.9 |
| Jeremy Evans | -1.1 | -3.1 / 0.9 |
| Jordan Hill | -1.1 | -3.1 / 0.9 |
| Julyan Stone | -1.1 | -3.1 / 0.9 |
| Martell Webster | -1.1 | -3.2 / 0.9 |
| Toney Douglas | -1.1 | -3.2 / 0.9 |
| Shaun Livingston | -1.1 | -3.2 / 0.9 |
| Marvin Williams | -1.1 | -3.2 / 0.9 |
| Avery Bradley | -1.1 | -3.2 / 0.9 |
| Malcolm Lee | -1.2 | -3.2 / 0.9 |
| Iman Shumpert | -1.2 | -3.2 / 0.9 |
| Austin Daye | -1.2 | -3.2 / 0.9 |
| Tayshaun Prince | -1.2 | -3.2 / 0.9 |
| Draymond Green | -1.2 | -3.2 / 0.8 |
| Jodie Meeks | -1.2 | -3.2 / 0.8 |
| Bernard James | -1.2 | -3.2 / 0.8 |
| Chris Kaman | -1.2 | -3.2 / 0.8 |
| Darren Collison | -1.2 | -3.2 / 0.8 |
| Malcolm Thomas | -1.2 | -3.3 / 0.8 |
| Samardo Samuels | -1.2 | -3.3 / 0.8 |
| Tornike Shengelia | -1.3 | -3.3 / 0.8 |
| Festus Ezeli | -1.3 | -3.3 / 0.8 |
| Jarrett Jack | -1.3 | -3.3 / 0.8 |
| Jamal Crawford | -1.3 | -3.3 / 0.8 |
| Dominique Jones | -1.3 | -3.3 / 0.7 |
| Ivan Johnson | -1.3 | -3.3 / 0.7 |
| Kirk Hinrich | -1.3 | -3.3 / 0.7 |
| Joel Anthony | -1.3 | -3.3 / 0.7 |
| Jason Maxiell | -1.3 | -3.3 / 0.7 |
| Nate Robinson | -1.3 | -3.3 / 0.7 |
| Jeff Green | -1.4 | -3.4 / 0.7 |
| Quincy Miller | -1.4 | -3.4 / 0.7 |
| Markieff Morris | -1.4 | -3.4 / 0.6 |
| Shawn Marion | -1.4 | -3.4 / 0.6 |
| Brandon Rush | -1.4 | -3.4 / 0.6 |
| Cole Aldrich | -1.4 | -3.4 / 0.6 |
| Kevin Jones | -1.4 | -3.4 / 0.6 |
| Kendrick Perkins | -1.4 | -3.4 / 0.6 |
| Jeremy Tyler | -1.5 | -3.5 / 0.6 |
| Hedo Turkoglu | -1.5 | -3.5 / 0.6 |
| Nazr Mohammed | -1.5 | -3.5 / 0.6 |
| Alonzo Gee | -1.5 | -3.5 / 0.6 |
| Jared Jeffries | -1.5 | -3.5 / 0.5 |
| Ian Mahinmi | -1.5 | -3.5 / 0.5 |
| Khris Middleton | -1.5 | -3.5 / 0.5 |
| Perry Jones | -1.5 | -3.5 / 0.5 |
| Al Harrington | -1.5 | -3.5 / 0.5 |
| Justin Holiday | -1.5 | -3.5 / 0.5 |
| Jerryd Bayless | -1.5 | -3.5 / 0.5 |
| Charlie Villanueva | -1.5 | -3.5 / 0.5 |
| Courtney Lee | -1.5 | -3.5 / 0.5 |
| A.J. Price | -1.5 | -3.5 / 0.5 |
| Jason Richardson | -1.5 | -3.6 / 0.5 |
| Chris Singleton | -1.5 | -3.6 / 0.5 |
| Kwame Brown | -1.6 | -3.6 / 0.5 |
| Tyler Honeycutt | -1.6 | -3.6 / 0.5 |
| Beno Udrih | -1.6 | -3.6 / 0.5 |
| Anthony Tolliver | -1.6 | -3.6 / 0.5 |
| Damion James | -1.6 | -3.6 / 0.5 |
| Andris Biedrins | -1.6 | -3.6 / 0.5 |
| Drew Gooden | -1.6 | -3.6 / 0.4 |
| Ray Allen | -1.6 | -3.6 / 0.4 |
| DaJuan Summers | -1.6 | -3.6 / 0.4 |
| Evan Turner | -1.6 | -3.6 / 0.4 |
| C.J. Watson | -1.6 | -3.6 / 0.4 |
| Dante Cunningham | -1.6 | -3.6 / 0.4 |
| Henry Sims | -1.6 | -3.6 / 0.4 |
| Jeff Pendergraph | -1.6 | -3.6 / 0.4 |
| Mike Miller | -1.6 | -3.7 / 0.4 |
| Daniel Orton | -1.6 | -3.7 / 0.4 |
| Josh Selby | -1.6 | -3.7 / 0.4 |
| Luke Ridnour | -1.6 | -3.7 / 0.4 |
| Jared Cunningham | -1.7 | -3.7 / 0.4 |
| Terrence Jones | -1.7 | -3.7 / 0.4 |
| J.J. Redick | -1.7 | -3.7 / 0.3 |
| Jason Terry | -1.7 | -3.7 / 0.3 |
| Devin Ebanks | -1.7 | -3.7 / 0.3 |
| Chris Wilcox | -1.7 | -3.7 / 0.3 |
| Louis Amundson | -1.7 | -3.7 / 0.3 |
| Darko Milicic | -1.7 | -3.7 / 0.3 |
| Alexey Shved | -1.7 | -3.7 / 0.3 |
| Carl Landry | -1.7 | -3.7 / 0.3 |
| P.J. Tucker | -1.7 | -3.8 / 0.3 |
| Fab Melo | -1.8 | -3.8 / 0.3 |
| Jae Crowder | -1.8 | -3.8 / 0.3 |
| Arnett Moultrie | -1.8 | -3.8 / 0.3 |
| Kyle Singler | -1.8 | -3.8 / 0.2 |
| Tyrus Thomas | -1.8 | -3.8 / 0.2 |
| Aron Baynes | -1.8 | -3.8 / 0.2 |
| Quincy Pondexter | -1.8 | -3.8 / 0.2 |
| Arron Afflalo | -1.8 | -3.8 / 0.2 |
| Kent Bazemore | -1.8 | -3.9 / 0.2 |
| Maurice Harkless | -1.8 | -3.9 / 0.2 |
| Francisco Garcia | -1.9 | -3.9 / 0.2 |
| Evan Fournier | -1.9 | -3.9 / 0.2 |
| Kris Joseph | -1.9 | -3.9 / 0.1 |
| Darius Johnson-Odom | -1.9 | -3.9 / 0.1 |
| Andrew Nicholson | -1.9 | -3.9 / 0.1 |
| Tyler Zeller | -1.9 | -3.9 / 0.1 |
| Shavlik Randolph | -1.9 | -3.9 / 0.1 |
| Tony Wroten | -1.9 | -4.0 / 0.1 |
| D.J. White | -1.9 | -4.0 / 0.1 |
| Reggie Jackson | -1.9 | -4.0 / 0.1 |
| Steve Novak | -2.0 | -4.0 / 0.1 |
| Cory Joseph | -2.0 | -4.0 / 0.1 |
| Rodrigue Beaubois | -2.0 | -4.0 / 0.1 |
| Viacheslav Kravtsov | -2.0 | -4.0 / 0.0 |
| Scott Machado | -2.0 | -4.0 / 0.0 |
| Meyers Leonard | -2.0 | -4.0 / 0.0 |
| Jeremy Lamb | -2.0 | -4.0 / 0.0 |
| Marreese Speights | -2.0 | -4.1 / 0.0 |
| Jan Vesely | -2.0 | -4.1 / 0.0 |
| Mike Scott | -2.0 | -4.1 / 0.0 |
| Jon Leuer | -2.0 | -4.1 / 0.0 |
| Chris Quinn | -2.0 | -4.1 / 0.0 |
| Andrea Bargnani | -2.1 | -4.1 / 0.0 |
| Robert Sacre | -2.1 | -4.1 / -0.1 |
| Marcus Thornton | -2.1 | -4.1 / -0.1 |
| Brandon Bass | -2.1 | -4.1 / -0.1 |
| Richard Jefferson | -2.1 | -4.1 / -0.1 |
| Dexter Pittman | -2.1 | -4.1 / -0.1 |
| DeSagana Diop | -2.1 | -4.1 / -0.1 |
| Sebastian Telfair | -2.1 | -4.1 / -0.1 |
| Tim Ohlbrecht | -2.1 | -4.1 / -0.1 |
| Miles Plumlee | -2.1 | -4.1 / -0.1 |
| Jarvis Varnado | -2.1 | -4.1 / -0.1 |
| Luke Babbitt | -2.1 | -4.2 / -0.1 |
| Shelvin Mack | -2.2 | -4.2 / -0.1 |
| Jamaal Tinsley | -2.2 | -4.2 / -0.1 |
| Maalik Wayns | -2.2 | -4.2 / -0.1 |
| Ryan Hollins | -2.2 | -4.2 / -0.1 |
| Chris Copeland | -2.2 | -4.2 / -0.1 |
| Lance Thomas | -2.2 | -4.2 / -0.2 |
| Justin Dentmon | -2.2 | -4.2 / -0.2 |
| Garrett Temple | -2.2 | -4.2 / -0.2 |
| Wayne Ellington | -2.2 | -4.3 / -0.2 |
| Corey Maggette | -2.3 | -4.3 / -0.2 |
| Udonis Haslem | -2.3 | -4.3 / -0.3 |
| James Jones | -2.3 | -4.3 / -0.3 |
| Josh Akognon | -2.3 | -4.3 / -0.3 |
| Thomas Robinson | -2.3 | -4.3 / -0.3 |
| Travis Outlaw | -2.3 | -4.3 / -0.3 |
| Jeff Taylor | -2.3 | -4.4 / -0.3 |
| Eric Maynor | -2.3 | -4.4 / -0.3 |
| Caron Butler | -2.3 | -4.4 / -0.3 |
| Terrence Williams | -2.4 | -4.4 / -0.3 |
| Patrick Mills | -2.4 | -4.4 / -0.3 |
| James Johnson | -2.4 | -4.4 / -0.4 |
| Kevin Murphy | -2.4 | -4.4 / -0.4 |
| Tyshawn Taylor | -2.4 | -4.4 / -0.4 |
| Reggie Williams | -2.4 | -4.4 / -0.4 |
| Diante Garrett | -2.5 | -4.5 / -0.4 |
| Derek Fisher | -2.5 | -4.5 / -0.4 |
| Chris Douglas-Roberts | -2.5 | -4.5 / -0.4 |
| Earl Watson | -2.5 | -4.5 / -0.5 |
| Cartier Martin | -2.5 | -4.6 / -0.5 |
| Earl Barron | -2.6 | -4.6 / -0.5 |
| DeAndre Liggins | -2.6 | -4.6 / -0.6 |
| John Lucas | -2.6 | -4.6 / -0.6 |
| Byron Mullens | -2.6 | -4.6 / -0.6 |
| Jose Barea | -2.6 | -4.6 / -0.6 |
| Stephen Jackson | -2.6 | -4.6 / -0.6 |
| Eddy Curry | -2.6 | -4.6 / -0.6 |
| D.J. Augustin | -2.6 | -4.7 / -0.6 |
| Marcus Morris | -2.6 | -4.7 / -0.6 |
| Aaron Gray | -2.6 | -4.7 / -0.6 |
| Dominic McGuire | -2.6 | -4.7 / -0.6 |
| Xavier Henry | -2.6 | -4.7 / -0.6 |
| Orlando Johnson | -2.6 | -4.7 / -0.6 |
| Jordan Crawford | -2.6 | -4.7 / -0.6 |
| Troy Murphy | -2.7 | -4.7 / -0.6 |
| Darius Miller | -2.7 | -4.7 / -0.6 |
| Damien Wilkins | -2.7 | -4.7 / -0.6 |
| Quentin Richardson | -2.7 | -4.7 / -0.6 |
| Solomon Jones | -2.7 | -4.7 / -0.7 |
| Luke Walton | -2.7 | -4.7 / -0.7 |
| Luke Zeller | -2.7 | -4.7 / -0.7 |
| Ben Hansbrough | -2.7 | -4.7 / -0.7 |
| Josh Childress | -2.7 | -4.7 / -0.7 |
| Marquis Daniels | -2.7 | -4.8 / -0.7 |
| Nick Young | -2.7 | -4.8 / -0.7 |
| Donatas Motiejunas | -2.7 | -4.8 / -0.7 |
| Roger Mason | -2.7 | -4.8 / -0.7 |
| Josh Howard | -2.8 | -4.8 / -0.8 |
| Terrel Harris | -2.8 | -4.8 / -0.8 |
| Rashard Lewis | -2.8 | -4.8 / -0.8 |
| Ishmael Smith | -2.8 | -4.9 / -0.8 |
| Lazar Hayward | -2.8 | -4.9 / -0.8 |
| Mo Williams | -2.9 | -4.9 / -0.8 |
| Kevin Seraphin | -2.9 | -4.9 / -0.9 |
| Timofey Mozgov | -2.9 | -5.0 / -0.9 |
| Joel Przybilla | -2.9 | -5.0 / -0.9 |
| Mickael Gelabale | -3.0 | -5.0 / -0.9 |
| Marco Belinelli | -3.0 | -5.0 / -0.9 |
| Hakim Warrick | -3.0 | -5.0 / -0.9 |
| Austin Rivers | -3.0 | -5.0 / -0.9 |
| Nolan Smith | -3.0 | -5.0 / -1.0 |
| Randy Foye | -3.0 | -5.0 / -1.0 |
| Steve Blake | -3.0 | -5.0 / -1.0 |
| Shannon Brown | -3.0 | -5.0 / -1.0 |
| Will Conroy | -3.0 | -5.0 / -1.0 |
| Mike James | -3.0 | -5.0 / -1.0 |
| Michael Beasley | -3.0 | -5.1 / -1.0 |
| Jimmer Fredette | -3.0 | -5.1 / -1.0 |
| Kurt Thomas | -3.0 | -5.1 / -1.0 |
| Terrence Ross | -3.0 | -5.1 / -1.0 |
| DeQuan Jones | -3.1 | -5.1 / -1.0 |
| Daniel Gibson | -3.1 | -5.1 / -1.1 |
| Mirza Teletovic | -3.1 | -5.1 / -1.1 |
| Cory Higgins | -3.1 | -5.1 / -1.1 |
| Marquis Teague | -3.1 | -5.1 / -1.1 |
| Leandro Barbosa | -3.1 | -5.2 / -1.1 |
| Keyon Dooling | -3.2 | -5.2 / -1.1 |
| Kendall Marshall | -3.2 | -5.2 / -1.2 |
| John Jenkins | -3.2 | -5.2 / -1.2 |
| Nando De Colo | -3.2 | -5.2 / -1.2 |
| Gary Neal | -3.2 | -5.2 / -1.2 |
| Gerald Green | -3.2 | -5.2 / -1.2 |
| Brian Roberts | -3.3 | -5.3 / -1.2 |
| Charles Jenkins | -3.3 | -5.3 / -1.3 |
| Victor Claver | -3.3 | -5.4 / -1.3 |
| Keith Bogans | -3.3 | -5.4 / -1.3 |
| Linas Kleiza | -3.4 | -5.4 / -1.3 |
| Darius Morris | -3.4 | -5.4 / -1.4 |
| E'Twaun Moore | -3.4 | -5.4 / -1.4 |
| Alan Anderson | -3.4 | -5.4 / -1.4 |
| Kim English | -3.4 | -5.4 / -1.4 |
| Daequan Cook | -3.4 | -5.4 / -1.4 |
| Joel Freeland | -3.4 | -5.5 / -1.4 |
| Wesley Johnson | -3.5 | -5.5 / -1.4 |
| Mickael Pietrus | -3.5 | -5.5 / -1.5 |
| Darrell Arthur | -3.5 | -5.5 / -1.5 |
| MarShon Brooks | -3.5 | -5.5 / -1.5 |
| Matt Carroll | -3.5 | -5.5 / -1.5 |
| Dahntay Jones | -3.5 | -5.5 / -1.5 |
| Will Bynum | -3.5 | -5.5 / -1.5 |
| Earl Clark | -3.5 | -5.6 / -1.5 |
| Aaron Brooks | -3.6 | -5.6 / -1.5 |
| Jason Collins | -3.6 | -5.6 / -1.5 |
| Chris Duhon | -3.6 | -5.7 / -1.6 |
| Anthony Morrow | -3.6 | -5.7 / -1.6 |
| Ronnie Price | -3.6 | -5.7 / -1.6 |
| Grant Hill | -3.7 | -5.7 / -1.6 |
| Johan Petro | -3.7 | -5.7 / -1.7 |
| Donald Sloan | -3.8 | -5.8 / -1.7 |
| Juwan Howard | -3.8 | -5.8 / -1.8 |
| Jerry Stackhouse | -3.8 | -5.8 / -1.8 |
| Andrew Goudelock | -3.9 | -5.9 / -1.9 |
| Will Barton | -3.9 | -5.9 / -1.9 |
| Sam Young | -3.9 | -5.9 / -1.9 |
| DeShawn Stevenson | -4.0 | -6.0 / -2.0 |
| Jannero Pargo | -4.0 | -6.1 / -2.0 |
| Willie Green | -4.1 | -6.2 / -2.1 |
| Sasha Pavlovic | -4.2 | -6.2 / -2.2 |
| Richard Hamilton | -4.2 | -6.2 / -2.2 |
| Doron Lamb | -4.3 | -6.3 / -2.2 |
| James White | -4.3 | -6.3 / -2.3 |
| Royal Ivey | -4.5 | -6.5 / -2.5 |
| Ben Gordon | -4.8 | -6.8 / -2.8 |
| Norris Cole | -5.0 | -7.0 / -3.0 |
| Jeremy Pargo | -5.1 | -7.2 / -3.1 |
Fourteen Scorers Remain (Sort of)
Assuming that the final four teams in the NBA playoffs are Miami, Indiana, San Antonio, and Memphis, (a big assumption) there are only 14 players with at least 100 minutes played who are taking at least 20% of their team's true-shooting attempts.
Sorted by points per 48 in the playoffs (LeBron has probably been hurt here by slower play, Parker vice versa).
Sorted by points per 48 in the playoffs (LeBron has probably been hurt here by slower play, Parker vice versa).
| Player | Pos | Tm | TS% | SA% | Pts/48 | TS% - Avg |
|---|---|---|---|---|---|---|
| Tony Parker | PG | SAS | 54.0% | 30.5% | 23.4 | 0.5% |
| LeBron James | PF | MIA | 62.5% | 28.1% | 22.3 | 9.0% |
| Tim Duncan | C | SAS | 50.3% | 27.1% | 19.4 | -3.2% |
| Manu Ginobili | SG | SAS | 51.2% | 24.8% | 18.1 | -2.2% |
| Jerryd Bayless | PG | MEM | 50.3% | 24.3% | 17.1 | -3.2% |
| Zach Randolph | PF | MEM | 56.0% | 24.2% | 19.0 | 2.6% |
| Paul George | SF | IND | 51.5% | 23.3% | 16.1 | -1.9% |
| Mike Conley | PG | MEM | 53.2% | 22.8% | 16.9 | -0.2% |
| Dwyane Wade | SG | MIA | 47.4% | 22.6% | 13.6 | -6.1% |
| David West | PF | IND | 54.3% | 21.9% | 16.0 | 0.8% |
| Ray Allen | SG | MIA | 65.4% | 21.8% | 18.2 | 11.9% |
| Marc Gasol | C | MEM | 57.0% | 21.5% | 17.1 | 3.6% |
| George Hill | PG | IND | 55.5% | 21.3% | 15.8 | 2.0% |
| Chris Bosh | C | MIA | 56.8% | 20.6% | 14.9 | 3.3% |
Also, check out Miami...
| Player | Pos | Tm | TS% | SA% | Pts/48 | TS% - Avg |
|---|---|---|---|---|---|---|
| LeBron James | PF | MIA | 62.5% | 28.1% | 22.3 | 9.0% |
| Chris Andersen | C | MIA | 78.0% | 18.8% | 18.7 | 24.5% |
| Ray Allen | SG | MIA | 65.4% | 21.8% | 18.2 | 11.9% |
| Norris Cole | PG | MIA | 77.3% | 15.2% | 15.0 | 23.9% |
| Chris Bosh | C | MIA | 56.8% | 20.6% | 14.9 | 3.3% |
| Dwyane Wade | SG | MIA | 47.4% | 22.6% | 13.6 | -6.1% |
| Udonis Haslem | PF | MIA | 59.7% | 16.0% | 12.2 | 6.3% |
| Mario Chalmers | PG | MIA | 52.4% | 14.5% | 9.7 | -1.0% |
| Shane Battier | SF | MIA | 43.2% | 14.9% | 8.2 | -10.2% |
The Sweet 16 and Beyond
Here are the results of my latest 10,000 simulations of the tournament.
Notable Notes:
Expected number of double-digit seeds in the Sweet 16: 2.5
Odds of all four 1-seeds making it to the Sweet 16: 27%
Odds of La Salle making it to the Sweet 16: 37%
| reg | sd | s16 | e8 | f4 | title game | Champ | exp. Wins | |
|---|---|---|---|---|---|---|---|---|
| E | 1 | Indiana | 90% | 69% | 55% | 36% | 23% | 3.74 |
| S | 3 | Florida | 78% | 65% | 44% | 26% | 16% | 3.28 |
| W | 1 | Gonzaga | 78% | 63% | 41% | 25% | 14% | 3.20 |
| MW | 1 | Louisville | 67% | 52% | 34% | 20% | 10% | 2.83 |
| W | 2 | Ohio St. | 73% | 51% | 28% | 15% | 7% | 2.74 |
| S | 4 | Michigan | 69% | 42% | 22% | 11% | 6% | 2.50 |
| MW | 2 | Duke | 64% | 41% | 22% | 11% | 5% | 2.43 |
| E | 2 | Miami FL | 70% | 46% | 16% | 7% | 3% | 2.42 |
| W | 6 | Arizona | 82% | 33% | 13% | 5% | 1% | 2.34 |
| MW | 3 | Michigan St. | 68% | 31% | 14% | 6% | 2% | 2.21 |
| E | 4 | Syracuse | 76% | 24% | 13% | 5% | 2% | 2.21 |
| S | 7 | San Diego St. | 82% | 21% | 7% | 2% | 1% | 2.12 |
| S | 1 | Kansas | 58% | 27% | 12% | 5% | 2% | 2.05 |
| MW | 4 | St. Louis | 65% | 20% | 9% | 3% | 1% | 1.98 |
| E | 3 | Marquette | 58% | 25% | 7% | 2% | 1% | 1.92 |
| W | 12 | Mississippi | 63% | 18% | 7% | 2% | 1% | 1.92 |
| MW | 8 | Colorado St. | 33% | 20% | 10% | 4% | 2% | 1.69 |
| S | 8 | North Carolina | 42% | 17% | 6% | 2% | 1% | 1.68 |
| MW | 7 | Creighton | 36% | 19% | 8% | 3% | 1% | 1.68 |
| E | 6 | Butler | 42% | 15% | 3% | 1% | 0% | 1.62 |
| S | 5 | Virginia Commonwealth | 31% | 13% | 4% | 1% | 0% | 1.51 |
| E | 7 | Illinois | 30% | 13% | 3% | 1% | 0% | 1.47 |
| W | 10 | Iowa St. | 27% | 14% | 4% | 1% | 0% | 1.47 |
| W | 13 | La Salle | 37% | 7% | 2% | 0% | 0% | 1.46 |
| MW | 12 | Oregon | 35% | 7% | 2% | 0% | 0% | 1.45 |
| MW | 6 | Memphis | 32% | 9% | 2% | 1% | 0% | 1.43 |
| S | 11 | Minnesota | 22% | 13% | 5% | 1% | 0% | 1.42 |
| W | 9 | Wichita St. | 22% | 12% | 4% | 1% | 0% | 1.40 |
| E | 12 | California | 24% | 3% | 1% | 0% | 0% | 1.28 |
| W | 14 | Harvard | 18% | 3% | 0% | 0% | 0% | 1.21 |
| S | 15 | Florida Gulf Coast | 18% | 1% | 0% | 0% | 0% | 1.19 |
| E | 9 | Temple | 10% | 3% | 1% | 0% | 0% | 1.15 |
Simulated Tournament, Luck-Adjusted Style
Alright...so I did another 10,000 simulations, but I used a combination of my luck-adjustments and Ken Pomeroy's strength of schedule to come up with some decent results. Notably, turnovers (offensive and defensive) are far more important here.
| ro32 | s16 | e8 | f4 | title game | Champ | exp. Wins | ||
|---|---|---|---|---|---|---|---|---|
| 1 | Indiana | 100% | 85% | 68% | 58% | 38% | 26% | 3.74 |
| 2 | Florida | 99% | 81% | 64% | 43% | 24% | 15% | 3.26 |
| 3 | Louisville | 100% | 71% | 59% | 39% | 23% | 12% | 3.03 |
| 4 | Gonzaga | 100% | 67% | 49% | 33% | 21% | 11% | 2.81 |
| 5 | Ohio St. | 97% | 70% | 49% | 25% | 13% | 6% | 2.60 |
| 6 | Michigan | 92% | 73% | 48% | 25% | 13% | 7% | 2.58 |
| 7 | Duke | 99% | 69% | 46% | 24% | 12% | 5% | 2.55 |
| 8 | Miami FL | 95% | 67% | 47% | 15% | 6% | 2% | 2.32 |
| 9 | Syracuse | 96% | 72% | 21% | 13% | 5% | 2% | 2.09 |
| 10 | Kansas | 99% | 62% | 29% | 11% | 4% | 2% | 2.07 |
| 11 | Georgetown | 97% | 63% | 19% | 8% | 3% | 1% | 1.90 |
| 12 | Michigan St. | 84% | 56% | 26% | 11% | 5% | 2% | 1.83 |
| 13 | Wisconsin | 73% | 56% | 24% | 13% | 7% | 3% | 1.76 |
| 14 | New Mexico | 88% | 51% | 19% | 6% | 2% | 1% | 1.67 |
| 15 | Marquette | 71% | 46% | 21% | 5% | 1% | 0% | 1.44 |
| 16 | Arizona | 73% | 39% | 15% | 5% | 2% | 0% | 1.34 |
| 17 | Pittsburgh | 73% | 28% | 17% | 10% | 5% | 2% | 1.34 |
| 18 | St. Louis | 75% | 43% | 11% | 4% | 1% | 0% | 1.34 |
| 19 | North Carolina | 75% | 33% | 12% | 4% | 1% | 1% | 1.26 |
| 20 | Creighton | 65% | 23% | 12% | 5% | 2% | 1% | 1.08 |
| 21 | Oklahoma St. | 61% | 32% | 7% | 3% | 1% | 0% | 1.04 |
| 22 | North Carolina St. | 74% | 13% | 7% | 4% | 1% | 0% | 0.99 |
| 23 | Colorado St. | 57% | 18% | 13% | 7% | 3% | 1% | 0.99 |
| 24 | Virginia Commonwealth | 67% | 19% | 8% | 2% | 1% | 0% | 0.97 |
| 25 | Butler | 56% | 25% | 9% | 1% | 0% | 0% | 0.91 |
| 26 | San Diego St. | 57% | 23% | 5% | 1% | 0% | 0% | 0.87 |
| 27 | Kansas St. | 60% | 20% | 4% | 1% | 0% | 0% | 0.86 |
| 28 | Notre Dame | 54% | 17% | 9% | 3% | 1% | 0% | 0.83 |
| 29 | Nevada Las Vegas | 59% | 18% | 3% | 1% | 0% | 0% | 0.81 |
| 30 | Minnesota | 58% | 12% | 6% | 2% | 1% | 0% | 0.79 |
| 31 | Colorado | 51% | 16% | 8% | 1% | 0% | 0% | 0.77 |
| 32 | St. Mary's | 44% | 21% | 8% | 3% | 1% | 0% | 0.76 |
| 33 | Illinois | 49% | 15% | 7% | 1% | 0% | 0% | 0.73 |
| 34 | Iowa St. | 46% | 12% | 6% | 2% | 1% | 0% | 0.67 |
| 35 | Bucknell | 44% | 17% | 5% | 1% | 0% | 0% | 0.67 |
| 36 | Missouri | 43% | 11% | 6% | 3% | 1% | 0% | 0.64 |
| 37 | Memphis | 42% | 15% | 4% | 1% | 0% | 0% | 0.62 |
| 38 | Oklahoma | 43% | 14% | 2% | 1% | 0% | 0% | 0.60 |
| 39 | Oregon | 39% | 17% | 3% | 1% | 0% | 0% | 0.59 |
| 40 | UCLA | 42% | 7% | 3% | 1% | 0% | 0% | 0.54 |
| 41 | California | 41% | 10% | 1% | 0% | 0% | 0% | 0.51 |
| 42 | Cincinnati | 35% | 8% | 3% | 1% | 0% | 0% | 0.46 |
| 43 | Mississippi | 27% | 15% | 3% | 1% | 0% | 0% | 0.46 |
| 44 | Davidson | 29% | 13% | 3% | 0% | 0% | 0% | 0.46 |
| 45 | Akron | 33% | 6% | 1% | 0% | 0% | 0% | 0.41 |
| 46 | Belmont | 27% | 8% | 2% | 0% | 0% | 0% | 0.37 |
| 47 | Wichita St. | 27% | 5% | 2% | 1% | 0% | 0% | 0.35 |
| 48 | New Mexico St. | 25% | 8% | 1% | 0% | 0% | 0% | 0.34 |
| 49 | Villanova | 25% | 5% | 1% | 0% | 0% | 0% | 0.32 |
| 50 | Boise St. | 23% | 6% | 1% | 0% | 0% | 0% | 0.31 |
| 51 | Temple | 26% | 2% | 0% | 0% | 0% | 0% | 0.29 |
| 52 | Valparaiso | 16% | 5% | 1% | 0% | 0% | 0% | 0.22 |
| 53 | La Salle | 16% | 3% | 0% | 0% | 0% | 0% | 0.20 |
| 54 | Middle Tennessee | 14% | 4% | 1% | 0% | 0% | 0% | 0.19 |
| 55 | Harvard | 12% | 2% | 0% | 0% | 0% | 0% | 0.14 |
| 56 | South Dakota St. | 8% | 2% | 0% | 0% | 0% | 0% | 0.10 |
| 57 | Pacific | 5% | 1% | 0% | 0% | 0% | 0% | 0.06 |
| 58 | Montana | 4% | 1% | 0% | 0% | 0% | 0% | 0.04 |
| 59 | Florida Gulf Coast | 3% | 1% | 0% | 0% | 0% | 0% | 0.04 |
| 60 | Iona | 3% | 0% | 0% | 0% | 0% | 0% | 0.04 |
| 61 | Northwestern St. | 1% | 0% | 0% | 0% | 0% | 0% | 0.01 |
| 62 | Western Kentucky | 1% | 0% | 0% | 0% | 0% | 0% | 0.01 |
| 63 | Albany | 1% | 0% | 0% | 0% | 0% | 0% | 0.01 |
| 64 | Southern | 0% | 0% | 0% | 0% | 0% | 0% | 0.00 |
| 65 | Long Island | 0% | 0% | 0% | 0% | 0% | 0% | 0.00 |
| 66 | North Carolina A&T | 0% | 0% | 0% | 0% | 0% | 0% | 0.00 |
| 67 | Liberty | 0% | 0% | 0% | 0% | 0% | 0% | 0.00 |
Simulated Tournament, LRMC Style
I simulated the NCAA tournament 10,000 times based on the LRMC ratings. Just a pure-point-margin version of Ken Pomeroy's table. Use responsibly!
| ro32 | s16 | e8 | f4 | title game | champ | Exp. Wins | ||
|---|---|---|---|---|---|---|---|---|
| 1 | Indiana | 100% | 87% | 70% | 55% | 31% | 19% | 3.62 |
| 2 | Florida | 96% | 85% | 72% | 52% | 34% | 22% | 3.61 |
| 3 | Gonzaga | 100% | 78% | 63% | 48% | 31% | 18% | 3.37 |
| 4 | Louisville | 100% | 77% | 63% | 41% | 23% | 11% | 3.16 |
| 5 | Kansas | 99% | 83% | 53% | 24% | 12% | 6% | 2.77 |
| 6 | Miami (FL) | 95% | 73% | 54% | 21% | 8% | 3% | 2.55 |
| 7 | Ohio St. | 94% | 71% | 48% | 21% | 11% | 4% | 2.50 |
| 8 | Duke | 96% | 57% | 39% | 21% | 10% | 4% | 2.28 |
| 9 | Michigan | 87% | 60% | 30% | 11% | 5% | 2% | 1.95 |
| 10 | Syracuse | 90% | 62% | 19% | 10% | 3% | 1% | 1.85 |
| 11 | Georgetown | 90% | 56% | 14% | 5% | 2% | 1% | 1.67 |
| 12 | Creighton | 77% | 37% | 23% | 11% | 5% | 2% | 1.55 |
| 13 | Michigan St. | 79% | 45% | 18% | 7% | 3% | 1% | 1.52 |
| 14 | Wisconsin | 68% | 49% | 16% | 9% | 4% | 1% | 1.46 |
| 15 | New Mexico | 81% | 41% | 17% | 5% | 2% | 0% | 1.45 |
| 16 | Saint Louis | 73% | 38% | 10% | 3% | 1% | 0% | 1.26 |
| 17 | Oklahoma St. | 64% | 38% | 11% | 4% | 1% | 0% | 1.18 |
| 18 | Marquette | 56% | 33% | 13% | 3% | 1% | 0% | 1.05 |
| 19 | VCU | 65% | 27% | 9% | 3% | 1% | 0% | 1.05 |
| 20 | UNLV | 67% | 27% | 5% | 2% | 1% | 0% | 1.02 |
| 21 | Arizona | 53% | 30% | 12% | 3% | 1% | 0% | 1.01 |
| 22 | Bucknell | 58% | 26% | 9% | 2% | 0% | 0% | 0.95 |
| 23 | Kansas St. | 64% | 24% | 4% | 2% | 1% | 0% | 0.95 |
| 24 | Pittsburgh | 59% | 15% | 8% | 4% | 2% | 1% | 0.89 |
| 25 | San Diego St. | 57% | 25% | 5% | 1% | 0% | 0% | 0.88 |
| 26 | Iowa St. | 58% | 18% | 9% | 2% | 1% | 0% | 0.87 |
| 27 | N.C. State | 68% | 11% | 5% | 2% | 1% | 0% | 0.86 |
| 28 | Belmont | 47% | 25% | 9% | 2% | 1% | 0% | 0.84 |
| 29 | North Carolina | 64% | 13% | 4% | 1% | 0% | 0% | 0.81 |
| 30 | Davidson | 44% | 24% | 8% | 2% | 0% | 0% | 0.78 |
| 31 | Minnesota | 61% | 10% | 5% | 1% | 0% | 0% | 0.78 |
| 32 | Colorado | 53% | 15% | 7% | 1% | 0% | 0% | 0.76 |
| 33 | Colorado St. | 52% | 12% | 7% | 3% | 1% | 0% | 0.75 |
| 34 | Middle Tenn. St. | 35% | 20% | 8% | 3% | 1% | 0% | 0.68 |
| 35 | Missouri | 48% | 10% | 6% | 2% | 1% | 0% | 0.67 |
| 36 | Memphis | 40% | 17% | 5% | 1% | 0% | 0% | 0.64 |
| 37 | Butler | 42% | 16% | 4% | 1% | 0% | 0% | 0.64 |
| 38 | Illinois | 47% | 11% | 5% | 1% | 0% | 0% | 0.63 |
| 39 | Oklahoma | 43% | 16% | 2% | 1% | 0% | 0% | 0.62 |
| 40 | Notre Dame | 42% | 10% | 4% | 1% | 0% | 0% | 0.56 |
| 41 | Oregon | 36% | 16% | 3% | 1% | 0% | 0% | 0.55 |
| 42 | Wichita St. | 41% | 7% | 4% | 2% | 1% | 0% | 0.55 |
| 43 | Mississippi | 32% | 17% | 3% | 1% | 0% | 0% | 0.54 |
| 44 | Akron | 35% | 10% | 2% | 0% | 0% | 0% | 0.48 |
| 45 | UCLA | 39% | 4% | 2% | 0% | 0% | 0% | 0.46 |
| 46 | St. Mary's | 25% | 12% | 4% | 1% | 0% | 0% | 0.43 |
| 47 | California | 33% | 9% | 1% | 0% | 0% | 0% | 0.43 |
| 48 | Villanova | 36% | 4% | 1% | 0% | 0% | 0% | 0.42 |
| 49 | New Mexico St. | 27% | 8% | 1% | 0% | 0% | 0% | 0.36 |
| 50 | Temple | 32% | 2% | 1% | 0% | 0% | 0% | 0.35 |
| 51 | Cincinnati | 23% | 5% | 2% | 0% | 0% | 0% | 0.31 |
| 52 | Boise St. | 21% | 6% | 1% | 0% | 0% | 0% | 0.28 |
| 53 | Valparaiso | 21% | 6% | 1% | 0% | 0% | 0% | 0.28 |
| 54 | Harvard | 19% | 4% | 0% | 0% | 0% | 0% | 0.23 |
| 55 | La Salle | 15% | 4% | 0% | 0% | 0% | 0% | 0.19 |
| 56 | South Dakota St. | 13% | 3% | 0% | 0% | 0% | 0% | 0.17 |
| 57 | Fla Gulf Coast | 10% | 3% | 0% | 0% | 0% | 0% | 0.13 |
| 58 | Montana | 10% | 2% | 0% | 0% | 0% | 0% | 0.13 |
| 59 | Iona | 6% | 2% | 0% | 0% | 0% | 0% | 0.08 |
| 60 | Pacific | 5% | 1% | 0% | 0% | 0% | 0% | 0.06 |
| 61 | Northwestern St. | 4% | 1% | 0% | 0% | 0% | 0% | 0.05 |
| 62 | Albany | 4% | 1% | 0% | 0% | 0% | 0% | 0.04 |
| 63 | West. Kentucky | 1% | 0% | 0% | 0% | 0% | 0% | 0.01 |
| 64 | Southern | 0% | 0% | 0% | 0% | 0% | 0% | 0.00 |
| 65 | LIU Brooklyn | 0% | 0% | 0% | 0% | 0% | 0% | 0.00 |
| 66 | Liberty | 0% | 0% | 0% | 0% | 0% | 0% | 0.00 |
| 67 | N.C. A&T | 0% | 0% | 0% | 0% | 0% | 0% | 0.00 |
Exactly How Good Is R. Kelly?
 |
| YOU SEE ME RUNNIN' THROUGH THAT OPEN DOOOOR. |
You might remember last season that I tweeted LeHigh's praises in terms of their ability to possibly beat Duke, *even before the brackets came out*...but my statistics pushed LeHigh's odds way up when we learned that Kelly wouldn't make the LeHigh game...because in my system, he was definitely their best player.
I've heard a lot of claims from all sorts of people on how good R. Kelly is...the boys over at 99.9 The Fan (Raleigh represent...) seem to think that he has made Duke's defense impeccably better. I'm not so sure...but only because Ken Pomeroy mentioned that in a blog post.
By my SPR measure that estimates per-100-possession impact, he is the best player in the ACC (same as Daniel Myers' ASPM. But I am more interested in how much worse their defense got with him out. Let us investigate.
I looked at Duke's expected efficiency differential based on kenpom.com efficiency stats (and home-court advantage), versus how they actually played, and here's the difference we see:

So despite Kelly's immense impact on offense, we can tell that at least Duke's defense looks better with him on the floor. Sixty-four places better.
All-Overrated and All-Underrated NBA Teams, 2013
All-Underrated Squad
Nate Robinson, PG
Andre Iguodala, SG
Thaddeus Young, SF
Nick Collison, PF
Kevin Garnett, C
All-Overrated Squad
Deron Williams, PG
JR Smith, SG
Klay Thompson, SF
Earl Clark, PF
Javale McGee, C
BOOM.
Subscribe to:
Posts (Atom)