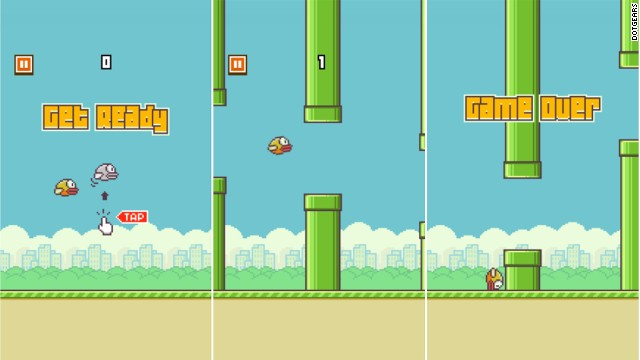
OK. So I love this game, Flappy Bird.
It's insanely stupid.
But my friends and I are playing it and competing over our best scores.
A couple of us started running stats on the game (of course), and I noticed some trends.
First of all, that my expected high score was much lower than my talent suggests! I get extremely nervous as I get nearer to high scores (among my friends' is currently 61) and end up dying shortly beforehand. So I wanted to quantify this.
First, the most basic principle for Flappy Birds - math (yes, you are still reading this...) is the following:
Where p represents the probability of dying on any given score.
For example: if my average score is 2, I am making it through 66% of all the pipes (2 successfully, failing on the 3rd. 2/3 = 66%). This is fairly straightforward.
Next I wanted to figure out my expected # of rounds by which I successfully get to each score. Couple of steps are required.
1) As of this writing, my (p) value is 94.0527% - (my average score is 15.8.) So I made a chart of probabilities. Probability of getting at least 0 points? 100%. Probability of getting at least 1 point? 94% of course. Probability of getting at least 2 means I've made it through the 94% twice, so 0.94^2 or 88.4%. And so on and so forth. So we now know that the inherent probability of making it to a certain number of points in the game is p^number of points.
2) By multiplying this probability by the number of trials I have completed, we have determined the number of expected times I should have reached at least __ number of points. I then compare this with the actual number of times I reached that number of points. The resultant chart is what I like to call my FBNG or "Flappy Bird Nervousness Graph":
As you can see I tend to do much better than expected in rounds 10-25, after which I taper off heavily to average/below average # of games finished with said score. So one could justifiably argue that I do fine until I hit 25. I honestly do start nervously looking at the score whereupon it gets into larger figures.
So from this graph I can see how I'm doing versus expected. But I want to know something simpler: what should my high score be? Currently mine is 57, but according to my 94% pipe clearance I can tell that I should be able to do better. In fact, my little chart of numbers shows that I should have at least 1* game of all the way up to around 74 according to the math! But I don't want to use a chart to guess and check. I want a formula.
So I can see that around (p of 0.94) ^ (74 games) is roughly 1. I want to see at what game # my (p) should hit EXACTLY 1.
I derived it like so:
(p^exp high score) * #GamesPlayed = 1
1/GamesPlayed = p^score
therefore
log with base (p) of 1/GamesPlayed = expected high score
or
When you plug this in, you'll see that 74 is close. Plugging in 94.0527% and 97 games gives you 74.61.
My high score is 57, so I've got to get over some nervousness so I can achieve my true high score.
* I thought about using 0.5, but 1.5 is just as relevant, so I settled on 1 which is in the middle.
Praise for The Basketball Distribution:
"...confusing." - CBS
"...quite the pun master." - ESPN


.png)


Wow. I used to keep box scores in a notebook for 'great baseball' on the original Sega, and even I find it incredible you did all this.
ReplyDeleteThat was awesome.
ReplyDeleteHey guys! I want to start a new series called 'Gaming'. This is where I'll post all of my gaming videos. I've only recorded one so request some games that you want me to play and I'll post a video of me playing it. To start off, I decided to play the most popular and frustrating game right now: FLAPPY BIRD. Enjoy! :)
ReplyDelete