
How does "effective likelihood of doing better than statistically expected" sound?
here's the first, second and third (r1, r2, and r3)
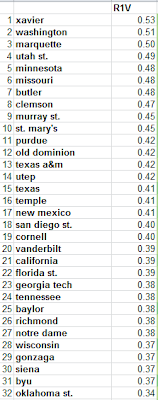


The first-round component gives us the most meaningful information (as the later rounds heavily favor better teams). Let's take a look at the results:
1) Xavier: as a 6-seed, beat 11-seed Minnesota and 3-seed Pittsburgh
2) Washington: as an 11-seed, beat 6-seed Marquette and 3-seed New Mexico
3) Marquette: lost to the (more-volatile) Washington
4) Utah St: lost to Texas A&M (who was just 0.07 lower in volatility)
5) Minnesota: lost to (highest-volatility) Xavier
other notables: the official Cinderella of 2010, Butler, was #7 (volatility of 0.48). Also, Cornell (who beat the 5 & 4 east seeds as a 12-seed), was ranked 19, with 0.4.
On to the second round:
1) West Virginia: made it to the Final-Four as a two-seed.
2) BYU: fell to Kansas St, who was 5th in volatility
3) Duke: Won the tournament...
4) Kentucky: Didn't make it past West Virginia, but succeeded as a (statistically) overrated team
5) Kansas St: Fell to Butler in the Elite 8 - pulled through in a pretty tough bracket though (statistically)
other notables: Butler is the highest-ranked 5-seed in 2nd-round volatility.
The third round doesn't tell us much new information, although Duke is the highest-ranked team here (in a bracket that statistically favored Kansas).
Anyways, the information here is hard to quantify, but I think some important things can be learned, especially from the first-round component!
No comments:
Post a Comment