By taking the simulated # of wins (via kenpom.com's numbers) and average wins for a given seed, we can rate who will have the best performance above what their seed predicts.
Here are the results for the field.


Quick Math on the bracket
Here is my preliminary results of my bracket simulation, based on stats from Kenpom.com
http://dl.dropbox.com/u/241759/MidwestWest.html
(not yet adjusted for teams' consistency)
http://dl.dropbox.com/u/241759/MidwestWest.html
(not yet adjusted for teams' consistency)
Game-Changers for NCAA Tourney Teams
Here we'll be taking a look at what is likely to alter a team's predicted final score (based on Ken Pomeroy's rankings - http://kenpom.com and the LRMC's rankings - http://www2.isye.gatech.edu/~jsokol/lrmc/)
The two things we'll be doing:
The two things we'll be doing:
1)We'll describe what part of Ken Pomeroy's Four Factors stats (of a team's opponents) affects the predicted outcome. Relies on = is ranked high in, does not rely on= is ranked low in. All these numbers can be found on the team pages at Kenpom.com
2) We'll measure a team's predictability (in terms of consistency of actual versus expected point margin with an average value of 10.9).
-Duke: (#1 Pomeroy, #2 LRMC, #2 bLRMC)
-Predictability: +1.1 points above average
-When opponents' offense relies on heavy free-throw shooting, Duke fares better. (Correlation of +.34)
-When opponents' defense DOES NOT rely on heavy defensive rebounding, Duke fares worse. (Correlation of -.28)
`
-Kansas: (#2 Pomeroy, #1 LRMC, #1 bLRMC)
-Predictability: -.2 points above average
-When opponents' offense relies on good field-goal shooting, Kansas fares worse. (Correlation of -.43)
-When opponents' offense relies on heavy offensive rebounding, Kansas fares better. (Correlation of +.33)
-Duke: (#1 Pomeroy, #2 LRMC, #2 bLRMC)
-Predictability: +1.1 points above average
-When opponents' offense relies on heavy free-throw shooting, Duke fares better. (Correlation of +.34)
-When opponents' defense DOES NOT rely on heavy defensive rebounding, Duke fares worse. (Correlation of -.28)
`
-Kansas: (#2 Pomeroy, #1 LRMC, #1 bLRMC)
-Predictability: -.2 points above average
-When opponents' offense relies on good field-goal shooting, Kansas fares worse. (Correlation of -.43)
-When opponents' offense relies on heavy offensive rebounding, Kansas fares better. (Correlation of +.33)
-When opponents' defense DOES NOT rely on field-goal percentage, Kansas fares worse. (Correlation of -.34)
-Wisconsin: (#3 Pomeroy, #13 LRMC, #9 bLRMC)
-Predictability: +.3 points above average
-Ohio St: (#4 Pomeroy, #7 LRMC, #5 bLRMC)
-Predictability: -.5 points above average
-Wisconsin: (#3 Pomeroy, #13 LRMC, #9 bLRMC)
-Predictability: +.3 points above average
-When opponents' offense relies on good field-goal shooting, Wisconsin fares worse. (Correlation of -.31)
-When opponents' defense relies on field-goal %, Wisconsin fares better. (Correlation of +.24)
-When opponents' defense relies on field-goal %, Wisconsin fares better. (Correlation of +.24)
-Predictability: -.5 points above average
-When opponents' offense relies on good field-goal shooting, Ohio St. fares better. (Correlation of +.24)
-When opponents' defense DOES NOT rely on field-goal %, Ohio St. fares worse. (Correlation of -.30)
-When opponents' defense DOES NOT rely on field-goal %, Ohio St. fares worse. (Correlation of -.30)
UPSET WATCH
NCAA tournament upset watch: Murray State and Pittsburgh are the two teams who will likely be mis-seeded the worst: http://dl.dropbox.com/u/241759/upsets.htm
Point-margin-based Chance of win.
While I think using the four factors can give us a much better picture of point-margin (and therefore, chance of win), let's just look at the 2nd step right now: deriving chance of win from expected point margin.
The Log5 formula used by many people (including Ken Pomeroy) to determine a team's chance of win is fairly accurate. It is based on fitting a model to theoretical results.
Slightly more accurate, I believe, is the LRMC (logistic regression markov chain) steady-state formula, which does the same thing, just to a much higher degree of accuracy; steady-states offer an actual theoretical explanation for the numbers based on team play rather than simply the normal distribution.
For example:
Duke's chances against Maryland, assuming a 2-pt-win-
Log5: 61%
LRMC: 59.8%
Huge difference, huh?
Finally, I must throw in my two cents: empirically, I think it is viable to say that specific teams play more consistently than others. In that way, we can alter win probabilities based on standard deviations of actual minus expected point margin (which explains the basis for this site's creation). Using those numbers (from Kenpom.com), we see that:
Duke's standard deviation of actual minus expected point margin is 9.77.
Maryland's standard deviation of actual minus expected point margin is 10.98
By Duke's numbers alone, we see their chance of win as being 58.1%
By Maryland's numbers alone, we see their chance of win as being 42.77%
By averaging these two values in their context (.581 and 1-.4277) we see that Duke's chance of winning should be around 57.7%
This allows us to solve (or at least partially resolve) Pomeroy's two prediction flaws: lack of accounting for consistency, and lack of accounting for diminishing returns. The first is obvious, the second is because team's expected play versus their actual play should reflect the error in his ratings derivations.
If I had enough time to scour through all the teams' data, I could give an adjusted Standard Deviations (or, 'Consistency') value for teams -- adjusting their consistency based on how consistent or inconsistent their opponents play.
The Log5 formula used by many people (including Ken Pomeroy) to determine a team's chance of win is fairly accurate. It is based on fitting a model to theoretical results.
Slightly more accurate, I believe, is the LRMC (logistic regression markov chain) steady-state formula, which does the same thing, just to a much higher degree of accuracy; steady-states offer an actual theoretical explanation for the numbers based on team play rather than simply the normal distribution.
For example:
Duke's chances against Maryland, assuming a 2-pt-win-
Log5: 61%
LRMC: 59.8%
Huge difference, huh?
Finally, I must throw in my two cents: empirically, I think it is viable to say that specific teams play more consistently than others. In that way, we can alter win probabilities based on standard deviations of actual minus expected point margin (which explains the basis for this site's creation). Using those numbers (from Kenpom.com), we see that:
Duke's standard deviation of actual minus expected point margin is 9.77.
Maryland's standard deviation of actual minus expected point margin is 10.98
By Duke's numbers alone, we see their chance of win as being 58.1%
By Maryland's numbers alone, we see their chance of win as being 42.77%
By averaging these two values in their context (.581 and 1-.4277) we see that Duke's chance of winning should be around 57.7%
This allows us to solve (or at least partially resolve) Pomeroy's two prediction flaws: lack of accounting for consistency, and lack of accounting for diminishing returns. The first is obvious, the second is because team's expected play versus their actual play should reflect the error in his ratings derivations.
If I had enough time to scour through all the teams' data, I could give an adjusted Standard Deviations (or, 'Consistency') value for teams -- adjusting their consistency based on how consistent or inconsistent their opponents play.
The rules for Step One.
Let's try this jam out on UNC.
The best way to predict a team's four factors in a future game is to create a linear regression involving their four factors, and their opponent's four factors.
Unfortunately, Ken Pomeroy has not yet adjusted the Four Factors for quality of opponent play (and for good reason - it's quite complicated). So we need to estimate how strength of schedule affects actual four factors. Unfortunately, I don't have any good way to run this analysis on every team. The best theory of adjustment would apply to all teams, but since there is a good chance that individual teams affect these numbers differently, it's not entirely bad to only regress on a team-by-team basis.
The next part of this is much harder.
We need to find the standard deviation of actual versus predicted four factors stats in order to run it through a Monte Carlo simulation that takes all likely normally-distributed values for all of the four factors+pace (which is 9 variables), which in turn spits out a point margin (whose values come from the previous post).
I'll be coming up with this system pretty soon, so watch out.
Step Two of the Two-Step Process
The best way to predict point margin is to first predict a team's four factors, then convert the four factors into point margin via linear regression.
The linear regression is the 2nd step, and here are the results (with an R^2 value of about .99)
(Numbers derived from http://kenpom.com)
Step one is a bit harder in some-ways, and should probably be done on a team-by-team basis. We'll cover that soon.
UNC's Injuries
Here's how UNC's injuries have affected their play, in terms of points. The number represents how Carolina does versus their average play.
(numbers based on Actual - Expected Point Margin, taking expected point margin from Kenpom.com)
(numbers based on Actual - Expected Point Margin, taking expected point margin from Kenpom.com)
| Davis | Zeller | Graves | Ginyard | |
| IN | -0.1 | 0.8 | -0.3 | -0.2 |
| OUT | -16.0 | -10.1 | -12.7 | -3.9 |
| Difference | 15.9 | 10.9 | 12.4 | 3.7 |
The One-Seeds
I told my friend Stephen that Kentucky will not be a 1-seed come tournament time.
That was a pretty dumb thing to say
I picked the top few teams that I thought might make #1 seeds, and did some analysis from their stats from Kenpom.com.
Anyways, here's my #1 seed bracketology: http://spreadsheets.google.com/pub?key=tdf4HIaf_vWtQhoNCxjHLdQ&single=true&gid=0&output=html
That was a pretty dumb thing to say
I picked the top few teams that I thought might make #1 seeds, and did some analysis from their stats from Kenpom.com.
Anyways, here's my #1 seed bracketology: http://spreadsheets.google.com/pub?key=tdf4HIaf_vWtQhoNCxjHLdQ&single=true&gid=0&output=html
Time Left on Shot Clock
By doing some simple multiplication and division of stats from kenpom.com, we can estimate the mean/median/expected number of seconds left on the shot clock when a team's possession will end.
I expect a high standard deviation of this number for most teams, but it is interesting to look at.
Here's the results (internet explorer might be required, hopefully not)
I expect a high standard deviation of this number for most teams, but it is interesting to look at.
Here's the results (internet explorer might be required, hopefully not)
Adjusted Player Offensive Ratings
I adjusted Ken Pomeroy's 100 most efficient college players (with a minimum of 40% minutes played) for opponents' quality of defense.
The results are here.
(EDIT: the Usage% represents how much a teams' possessions a player ends up 'using' via shots/turnovers/etc. players under 20% are below average in usage. I will soon adjust only those who are above the 20% mark)
The results are here.
(EDIT: the Usage% represents how much a teams' possessions a player ends up 'using' via shots/turnovers/etc. players under 20% are below average in usage. I will soon adjust only those who are above the 20% mark)
Texas v. UNC
Ken Pomeroy's Stats predict Carolina to lose to Texas by 20 points. Here's my basic info you need to know on these 2 teams:
this gives us an average of 8.97 for both teams
-a 68.2% chance that Carolina's final margin is between {-11 and -29}

1) Texas' point margin vs. predicted has a standard deviation of about 8.07 points
2) North Carolina's point margin vs. predicted has a standard deviation of about 9.86
this gives us an average of 8.97 for both teams
which means that there is, according to the normal distribution:
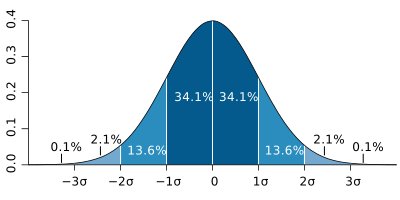
-a 68.2% chance that Carolina's final margin is between {-11 and -29}
-a 95.4% chance that Carolina's final margin is between {-2 and -38}
Simply by using standard deviations, Carolina has a 1.29% chance of winning, less than Ken Pomeroy's estimation (using the Log5 method) of 5%
Nathan's Statistical Rankings
Here is a link to my statistical rating of college basketball teams, according to my best possible model given the stats I currently have (which is similar in nature to the LRMC model, and similar in appearance to Sagarin ratings).
http://tinyurl.com/nathansrankings
Hopefully in January I will have a model adjusted including diminishing returns, consistency, and 'game point margin' which accurately reflects the 'real score' of a game, rather than one that was altered in the last 30 seconds to a game-insignificant-degree. (To do this, we will use Bill James' "time statistically over" stat from Statsheet.com).
Hopefully in January I will have a model adjusted including diminishing returns, consistency, and 'game point margin' which accurately reflects the 'real score' of a game, rather than one that was altered in the last 30 seconds to a game-insignificant-degree. (To do this, we will use Bill James' "time statistically over" stat from Statsheet.com).
UNC's terrible 2nd halves
Carolina is beating their opponents by .36 points per possession in the first half of their games.
But in the second half, they average -.04 points per possession.
Not good!
Oliver-Adjusted PlusMinus
Rather than using the standard model for plus-minus, I am going to start using one of my own, which I will test on data I get on the homeschool girls team I do stats on.
Currently, the players have their own value, based on (Points Produced - Points 'Allowed') / Possessions Played In, (which I call 'net') based on their Dean Oliver ORTG and DRTG stats.
I don't strictly use the DRTG version points 'allowed,' which is =(1-stop%)*DptsPerScPoss*Dposs.
Dean Oliver admits the weaknesses of his formula, so I average this with the stats on "Defensive points allowed" that the girls' team keeps, based on how many points they were the primary reason for allowing (before converting this number to a per 100 possession number).
This "net" stat is the one I primarily use to evaluate players in practices, but in games I also use the good ol' plus-minus stat. For my purposes, I do (PlusMinus ONcourt/poss played) - (Plusminus Oncourt/poss not played) to give a sort of "teamwork" value. The plusminus stat is prone to have lots of error on its own. Especially in the case of how I measure it, it is expected that there would be a lot of error for players who play significantly low or high minutes. That is to say, those who play closer to 0% and 100% of the minutes than 50% have less samples of EITHER possessions played or possessions not played. Furthermore, plusminus does not account for improvement or decrease in team that have relatively little to do with the player in question.
Knowing the biases of both of these formulas, I thought I might use them in tandem with On-Court offensive efficiency and defensive efficiency (which I actually have for the girls team now). Furthermore, the coefficients used by people like Dan Rosenbaum in statistical plus-minus are good things to use, but using Dean Oliver's ORTG and DRTG as the modifying numbers in a formula are likely to be much more representative of a player's statistical throughput.
So, without further ado, I would like to present my method for finding the Oliver-Adjusted PlusMinus.
(Of note: I have data on players that simple box-scores absolutely do not give, and that would be relatively time-consuming to extract from play-by-play. This is: the players on the court at any given time, and the efficiency of that 5-(wo)man group has offensively and defensively)
All of this data will be extracted on a player-by-player basis from each separate substitution (i.e., each individual 5-man team. duplicates must also be taken care of).
First, we must estimate what Kevin Pelton calls the 'fudge factor' (ff) to get a predicted Offensive efficiency. We first sum all the players' on-court Usage% from the game in question; this is the 'fudge factor'. This sum is now our divisor: we now divide each player's game usage % by the fudge factor, which now gives us a sum Usg% of One. Then each player is assigned a predicted points produced, by multiplying their Usg% by their game ORTG.
For each player, we can get a predicted teammates' points produced simply by summing their teammates' (ORTG*(usg%/ff)*possessions played until next substitution. This gives us PREDICTEDteammatePProd, or, P
Then also for each individual player, we subtract their personal predicted points produced (ORTG*(usg%/ff)*possessions played until next substitution) from the actual amount of points produced in the current lineup, to give us an estimated ACTUAL number of teammates' points produced. This gives us eACTUALteammatePtsProduced or, A
By then doing P/A, we have a coefficient that estimates how a player benefits their team offensively, in effect, an adjustment factor for their teammates' ORTG, which we can call OTC. We can do the same with defensive stats (except usage is stuck at the estimated 20%), to get a coefficient for effect on teammates' DRTG, which we can call DTC.
I foresee some problems that will come about from this, and both of these will likely have to be adjusted from the obvious future stat Oc and Dc, which is how much a player's teammates affected their own ORTG and DRTG.
After bridging this unfortunately difficult gap, we can then combine a player's personal [(Points Produced / Oc) - (Points Allowed / Dc) + (Average Teammates' Points Produced * OTc) - (Average Teammates' Points Allowed * DTc) ]/(Possessions Played in*100) to get an adjusted PlusMinus.
Hopefully I can get there soon...
Theoretically Correct RPI, Part I
The Rating Percentage Index, or 'RPI' is College Basketball's tamer BCS computer system (i.e. - it's unfair). By weighting three simple numbers, it assigns each team a score.
RPI = (.25 * Team's Winning %) + (.5 * Opponents' Winning %) + (.25 * Opponents' Opponents' Win%)
However, a better methodology would be to reverse-engineer Bill James' Log5 method and adjust for a teams' schedule.
The simpler (non-adjusted) version looks like this:
WPct = .500 + A - B (http://www.diamond-mind.com/articles/playoff2002.htm) which means: Team's Win% = .5 + Real Win% - Opponents' Real Win%
WPct = .500 + A - B (http://www.diamond-mind.com/articles/playoff2002.htm) which means: Team's Win% = .5 + Real Win% - Opponents' Real Win%
A little explanation is required here: Bill James' values for A and B are based on how often they beat teams in general. That is to say, if a team has played EVERY team on equal footing (a perfectly adjusted strength of schedule).
the number we want is "Real Win%," so with some algebra, we get: Rwin%=Twin%-.5+O.Rwin% where O.Rwin% roughly equals: O.Rwin%=OTwin%-.5+O.OTwin% (which we get by estimating that the "O.OTwin%" or "Opponents' Opponents' Team Winning%" is roughly equal to their "Real" win %)
Therefore, a team's "real" win% roughly equals:Rwin%=Twin%-.5+(OTwin%-.5+O.OTwin%)
=Twin%+O.Twin%+O.OTwin%-1 This shows us that a teams' win%, opponents' win%, & opponents' opponents' win% are all roughly EQUALLY weighted in figuring out their 'real' value.So a better simple RPI would be RPI= Team's Winning % + Opponents' Winning + Opponents' Opponents' Win% -1
In the next post, we will examine the 'normally-adjusted' version.
Fixing the current models...
Ken Pomeroy and the LRMC (logistic regression-markov chain) models for predicting NCAA winners are both incredibly accurate, but they both have their own flaws -- for similar reasons.
Ken Pomeroy's measure eliminates pace, but this takes away a good portion of basketball's psychological strategy of gaining a large lead. For example, at halftime, a team that is up by 10 points could have either been very efficient and slow (which Kenpom would measure as good) or less efficient but very fast - (which Kenpom does not measure as a good thing). While it is not GOOD to be inefficient, the barrier of ten points is still in the way for the losing team, despite the inefficiency. The comeback is still required, and is a psychological barrier.
Furthermore, Ken Pomeroy (using Bill James' pythagorean expectation formula instead of Dean Oliver's formula including standard deviation) asserts that the head-to-head better team should have the higher winning percentage. This is a false assumption even when all anamolies are taken care of. The fact of the matter is -- whichever team is most efficient is most likely to win in a competition; but the slower the team is, the more likely they are to lose to a worse team(the smaller the point barrier to overcome, the more likely that the worse team can overcome it). This is indirectly mentioned by Dean Oliver in Basketball on Paper in his section on standard deviation, variance, and covariance, etc.
The LRMC, on the other hand, only uses point margin in its calculations. While this effectively works with the idea of a 'point barrier,' it might not work as well in head-to-head, as we know, greater efficiency will always lead to more points, even if the margin is small. Furthermore, as we know, teams that are slow might also be ranked lowly on the LRMC, which would ignore the higher percent of wins that slow teams get against better teams.
Thirdly - neither of these formulas take consistency into account.
So to make the best model, we must use one that includes consistency, but combines the idea of a 'point barrier' and efficiency. It must also be two rankings: head to head and overall win%.
Win%=????
I finally bought Dean Oliver's book, "Basketball on Paper" -- and I think I am onto a breakthrough!
Win%=NormsDist(Point Margin/Standard Deviation of Point Margin)
Chance of Win%=Normsdist(Predicted Point Margin/Standard Deviation of Actual Minus Predicted Point Margins of both Teams)
Dean Oliver actually uses a statistical formula based on standard deviation to prove the percent chance that a team will win a game! Unfortunately, Dean has not done nearly as much as Ken Pomeroy in terms of figuring out how to adjust statistics for quality of opponents. So currently I am working on a system that turns Kenpom's predictions into chance of win.
Dean Oliver's formula is as follows:
Win%=NormsDist(Point Margin/Standard Deviation of Point Margin)
so if I perhaps used Kenpom's predictions--
Chance of Win%=Normsdist(Predicted Point Margin/Standard Deviation of Actual Minus Predicted Point Margins of both Teams)
This gives us a good number (for example, 2008-2009 North Carolina posts an on-season 96.5%, whereas the Log5 formula puts them at 97.7%) -- but I am still unable to adjust for opponents' inconsistency. Oh well -- it's definitely a step in the right direction!
Subscribe to:
Posts (Atom)