
My prior post has sparked a little bit of interest/intrigue/outrage/fear among college basketball fans.
Never fear! Happier numbers are on the way.
First, let me reiterate that these are based on advanced stats only, such as offensive rating and defensive rating, from Sports-Reference.com. There are no plus-minus stats involved.
I realized that there were some pretty important adjustments that needed to be made. First, that players with extremely high numbers in any one category were being skewed.* Second, that the strength of schedule adjustment was a little counter-intuitive, and a little too strong. I adjusted my ratings thusly.
Unfortunately, the sample size for this season does not produce very intuitive results at the moment, which I should have mentioned in my last post (so please don't destroy me for anything that looks strange...just chew on it). For example, that Weber State's Damian Lillard is number one in the system. While I am a huge fan of Lillard and would have no problem listing him up there at the end of the year if things remain the same, I am wary of the fact that his team impact is two full points higher than the next-highest (and his per-possession impact is higher than Sullinger's). As major-conference teams improve their strength of schedules during conference play and players get more minutes, things will even out.
As proof that things will even out, here is last year's top-10 in terms of overall Team Impact (efficiency impact times minutes-on-the-floor%). We can call this the Holy Grail 3.0
| Player | School | Impact(100) | Team Eff. Impact |
| Kemba Walker | Connecticut | 13.1 | 12.1 |
| Jordan Taylor | Wisconsin | 12.4 | 11.2 |
| Talor Battle | Penn State | 10.3 | 9.8 |
| Jimmer Fredette | Brigham Young | 11.0 | 9.7 |
| Jared Sullinger | Ohio State | 12.2 | 9.6 |
| JaJuan Johnson | Purdue | 10.4 | 9.2 |
| Derrick Williams | Arizona | 11.8 | 8.7 |
| Jon Leuer | Wisconsin | 10.4 | 8.7 |
| Ben Hansbrough | Notre Dame | 9.7 | 8.4 |
| Jon Diebler | Ohio State | 9.3 | 8.3 |
I hope most people wouldn't have a problem with this list.
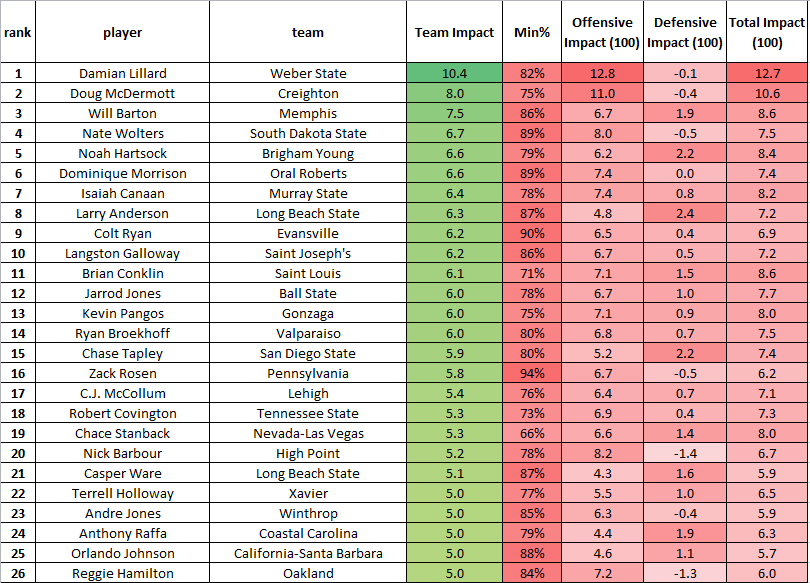
So here are the current numbers, which are now split into offense and defense...separated by the Top-26 Major Conference Players and the Top 26 not-so-Major Conferences. (Had to include the older Zeller. It's the law.)
Major:

Not-So-Major:
Notice I refrained from ranking players by their per-possession numbers...I think these are more intuitive and represent Player-of-the-Year candidates (if your coach didn't play you enough, you unfortunately didn't impact your team enough).
And look, Hummel is on a list! Now everyone can be happy. Even me!
* My method involved dividing advanced statistics such as Steal%, Assist%, or Offensive Rating by their league average. My NBA numbers had extremely high sample sizes and didn't have any problem with skewed numbers...here we have that problem a lot more, especially in smaller categories (such as Steal%) rather than larger categories (the more all-encompassing "Offensive Rating").
No comments:
Post a Comment